Ethereum Holds Key Support as Buyers Defend Long-Term Trendline
Key Takeaways
- •Ethereum traded at $2,269, gaining approximately 0.6% during the session.
- •Support near $2,154-$2,159 held as the 200-day average overlapped with the 0.500 Fibonacci retracement.
- •The cryptocurrency recovered above its rising 2021 trendline, currently located near $2,100.
- •Technical resistance is concentrated between roughly $2,471 and $2,517, with several chart references near $2,500.
- •Sustained daily and weekly closes below the $2,159-$2,100 support area could expose levels near $2,001, $1,839 and $1,783.
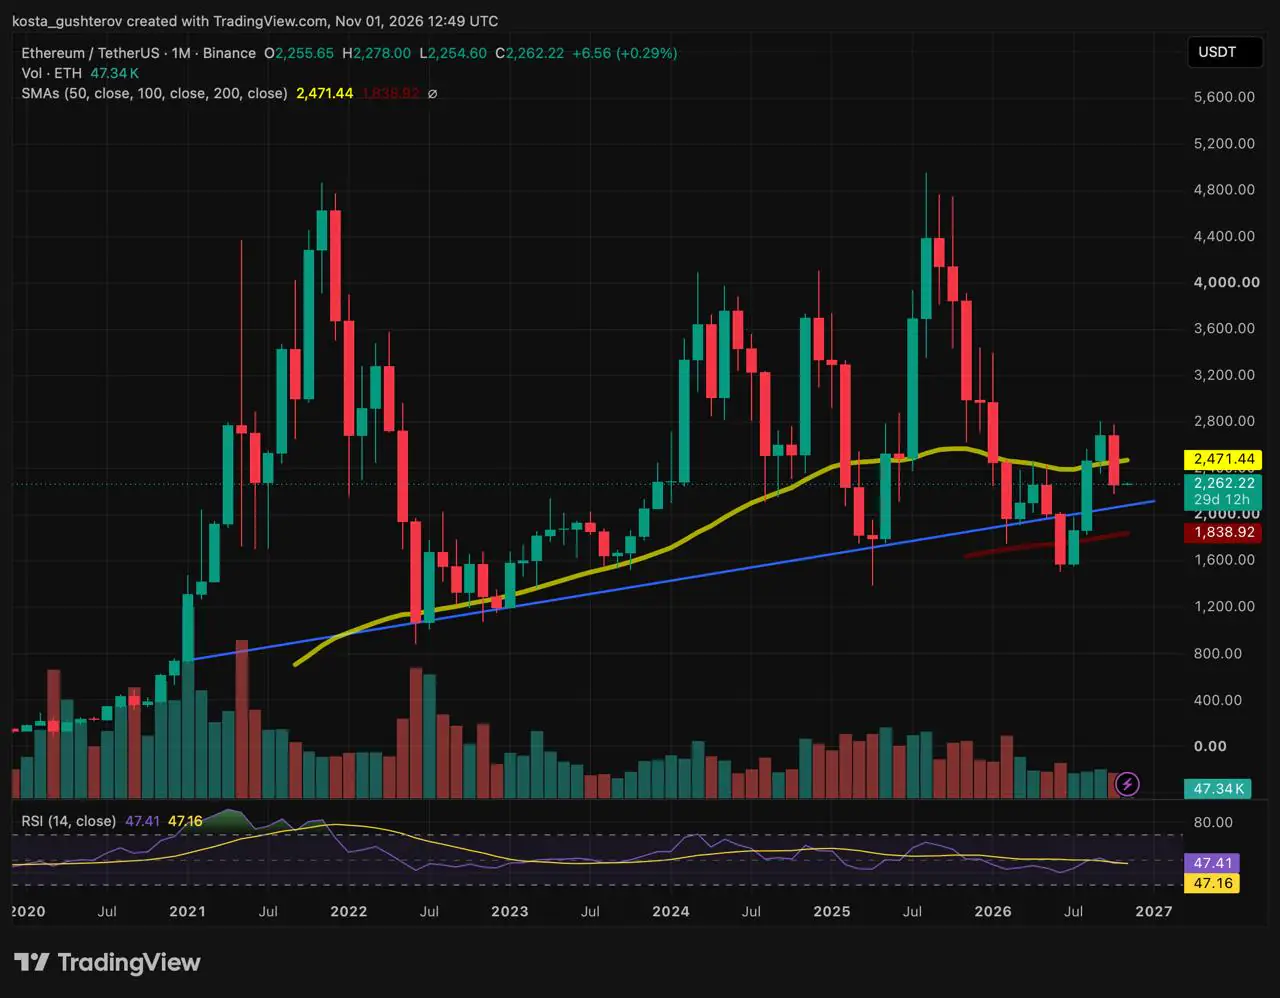
Ethereum recovered above a long-term trendline dating to 2021 after a sharp decline tested several technical support levels. The 200-day simple moving average (SMA) and the 0.500 Fibonacci retracement held the drop, while resistance is concentrated near $2,500 on both the monthly and daily charts.
ETH traded at $2,269 at 16:48 UTC on Sunday, up approximately 0.6%, or $13, for the day, according to the Binance ETH/USDT chart. Daily relative strength index (RSI) recovered after approaching 30, a threshold conventionally treated as oversold on this momentum indicator.
Ethereum Reclaims the 2021 Trendline
On the monthly chart, a rising blue trendline begins in early 2021 near $750 to $800. The line caught Ethereum’s 2022 low and has guided the cryptocurrency’s long-term uptrend, although it has not held without interruption. Trendlines anchored to lows spanning several years are widely used as a reference for whether a market’s broader structure remains intact, which is why reclaims and retests of this line draw close attention. A monthly wick moved below it in 2025, and price fell through the line in mid-2026 before reaching a low of $1,505. That low was close to the rising red 100-month average at $1,839.
A strong late-summer rally then lifted ETH back above the trendline and carried it to a cycle peak of $2,803. August and September closed above the yellow 50-month average at $2,471. October, however, formed a red candle that moved back below the average and returned to the trendline, which is now rising through approximately $2,100. October closed at $2,256, while November opened above the line.
Momentum on the monthly timeframe is balanced. The 14-month RSI stands at 47.41, just above its yellow signal line at 47.16. The readings indicate that the longer-term trend is steadying rather than breaking down.
Daily Chart Shows Support Test
The daily chart shows the extent of the recent test. In late October, ETH fell below its red 100-day average at $2,346 and the 0.382 Fibonacci level near $2,307. The following candle then dropped to the 0.500 Fibonacci midpoint near $2,154 and the purple 200-day average at $2,159, with the monthly trendline just below those levels. Buyers emerged around that group of support and pushed the close back to $2,256. The 200-day average is among the most closely watched references for long-term trend conditions, and its overlap with the 0.500 retracement concentrated technical interest at the $2,154–$2,159 area.
Selling did not return during the current session. The candle opened at $2,256, dipped by $1 to $2,255, rose to $2,278 and was trading at $2,269. Volume increased to 63,130 ETH, or approximately $143.2 million, without a retest of the previous day’s lows.
The 14-day RSI moved close to the 30 oversold level during the decline, marking its lowest reading since the June bottom. It has since turned higher to 33.83, narrowing the gap with its signal line at 36.48.
Key Levels Form a Trading Corridor
Viewed together, the monthly and daily charts place Ethereum within a corridor of roughly $2,100 to $2,517. Both the lower and upper boundaries are supported by multiple technical references. When several references sit within a tight range, the resulting zone provides clearly defined boundaries for judging whether support or resistance is holding.
The floor is particularly concentrated, with its three references positioned within approximately 3% of one another. Resistance near $2,500 is similarly crowded and marked the point where recovery attempts stalled in October. The daily averages also remain in bullish order: the 50-day average is above the 100-day average, and the 100-day average is above the 200-day average.
The mid-2026 move below the trendline now resembles a bear trap in hindsight, while October’s decline can be viewed as a retest of previously reclaimed support. The current candle’s nearly nonexistent lower wick indicates that selling pressure eased at the floor as daily RSI approached oversold conditions. If that support remains intact, the broken $2,307–$2,346 zone would be the first area to test, followed by the resistance ceiling near $2,500.
The principal levels and their chart references are:
- $2,803: Daily chart cycle peak and 0 Fibonacci level, established in late September.
- $2,471–$2,517: Both charts; the 50-month SMA at $2,471, the 0.236 Fibonacci level near $2,497 and the 50-day SMA at $2,517.
- $2,307–$2,346: Daily chart; the 0.382 Fibonacci level and the 100-day SMA, forming the broken zone that would need to be reclaimed.
- $2,278: Both charts; the current session’s high and the first minor hurdle.
- $2,269: Current price, up 0.6% on the day.
- $2,255–$2,256: Both charts; November’s monthly and daily open and the current session’s low.
- $2,154–$2,159: Daily chart; the 0.500 Fibonacci midpoint and the 200-day SMA, forming the main floor.
- Approximately $2,100: Monthly chart; the rising trendline from 2021 and reclaimed support.
- $2,001: Daily chart; the 0.618 golden pocket, near the round-number level of $2,000.
- $1,783–$1,839: Both charts; the 0.786 Fibonacci level near $1,783 and the 100-month SMA at $1,839.
- $1,505: Daily chart; the June low near the 1.0 Fibonacci level, where the rally began.
The Fibonacci levels are drawn on the daily chart from the June low to the cycle peak. “1M” denotes the monthly chart, while “1D” denotes the daily chart.
Conditions That Could Shift the Setup
The next direction depends on where subsequent daily and weekly closes land rather than on a forecast of which path will occur.
A daily close firmly above $2,265, followed by a break of the current session’s $2,278 high and a move by daily RSI back above its signal line, could open a test of the 0.382 level near $2,307 and the 100-day average at $2,346. A daily close above $2,346 would repair the late-October breakdown and bring the upper part of the corridor back into view, ranging from the 50-month average at $2,471 to the 50-day average at $2,517.
Conversely, if the move toward resistance stalls below the $2,307–$2,346 zone and ETH records both a daily and weekly close below the 200-day average at $2,159 and the trendline near $2,100, the three-layer floor would be lost and the trendline retest would have failed. That would expose the golden pocket near $2,001, followed by deeper support at the 100-month average of $1,839 and the 0.786 Fibonacci level near $1,783.
Even in the latter scenario, ETH would remain well above its June low of $1,505. However, the 2021 trendline would be lost after Ethereum reclaimed it once this year and tested it once since.
This article is provided for informational purposes only and does not constitute financial or investment advice. Technical levels and scenarios do not guarantee future price movement.

