Ethereum Price Slides Toward $2,500 as Analysts Watch Whether Solana Follows
Key Takeaways
- •Ethereum dropped 5.60% in 24 hours to $2,558.66 and is down 5.86% over the past seven days, with daily trading volume near $18.76 billion.
- •Analyst Ali Charts said Ethereum broke below its range channel and identified2,540 and $2,500 as the next visible downside levels.
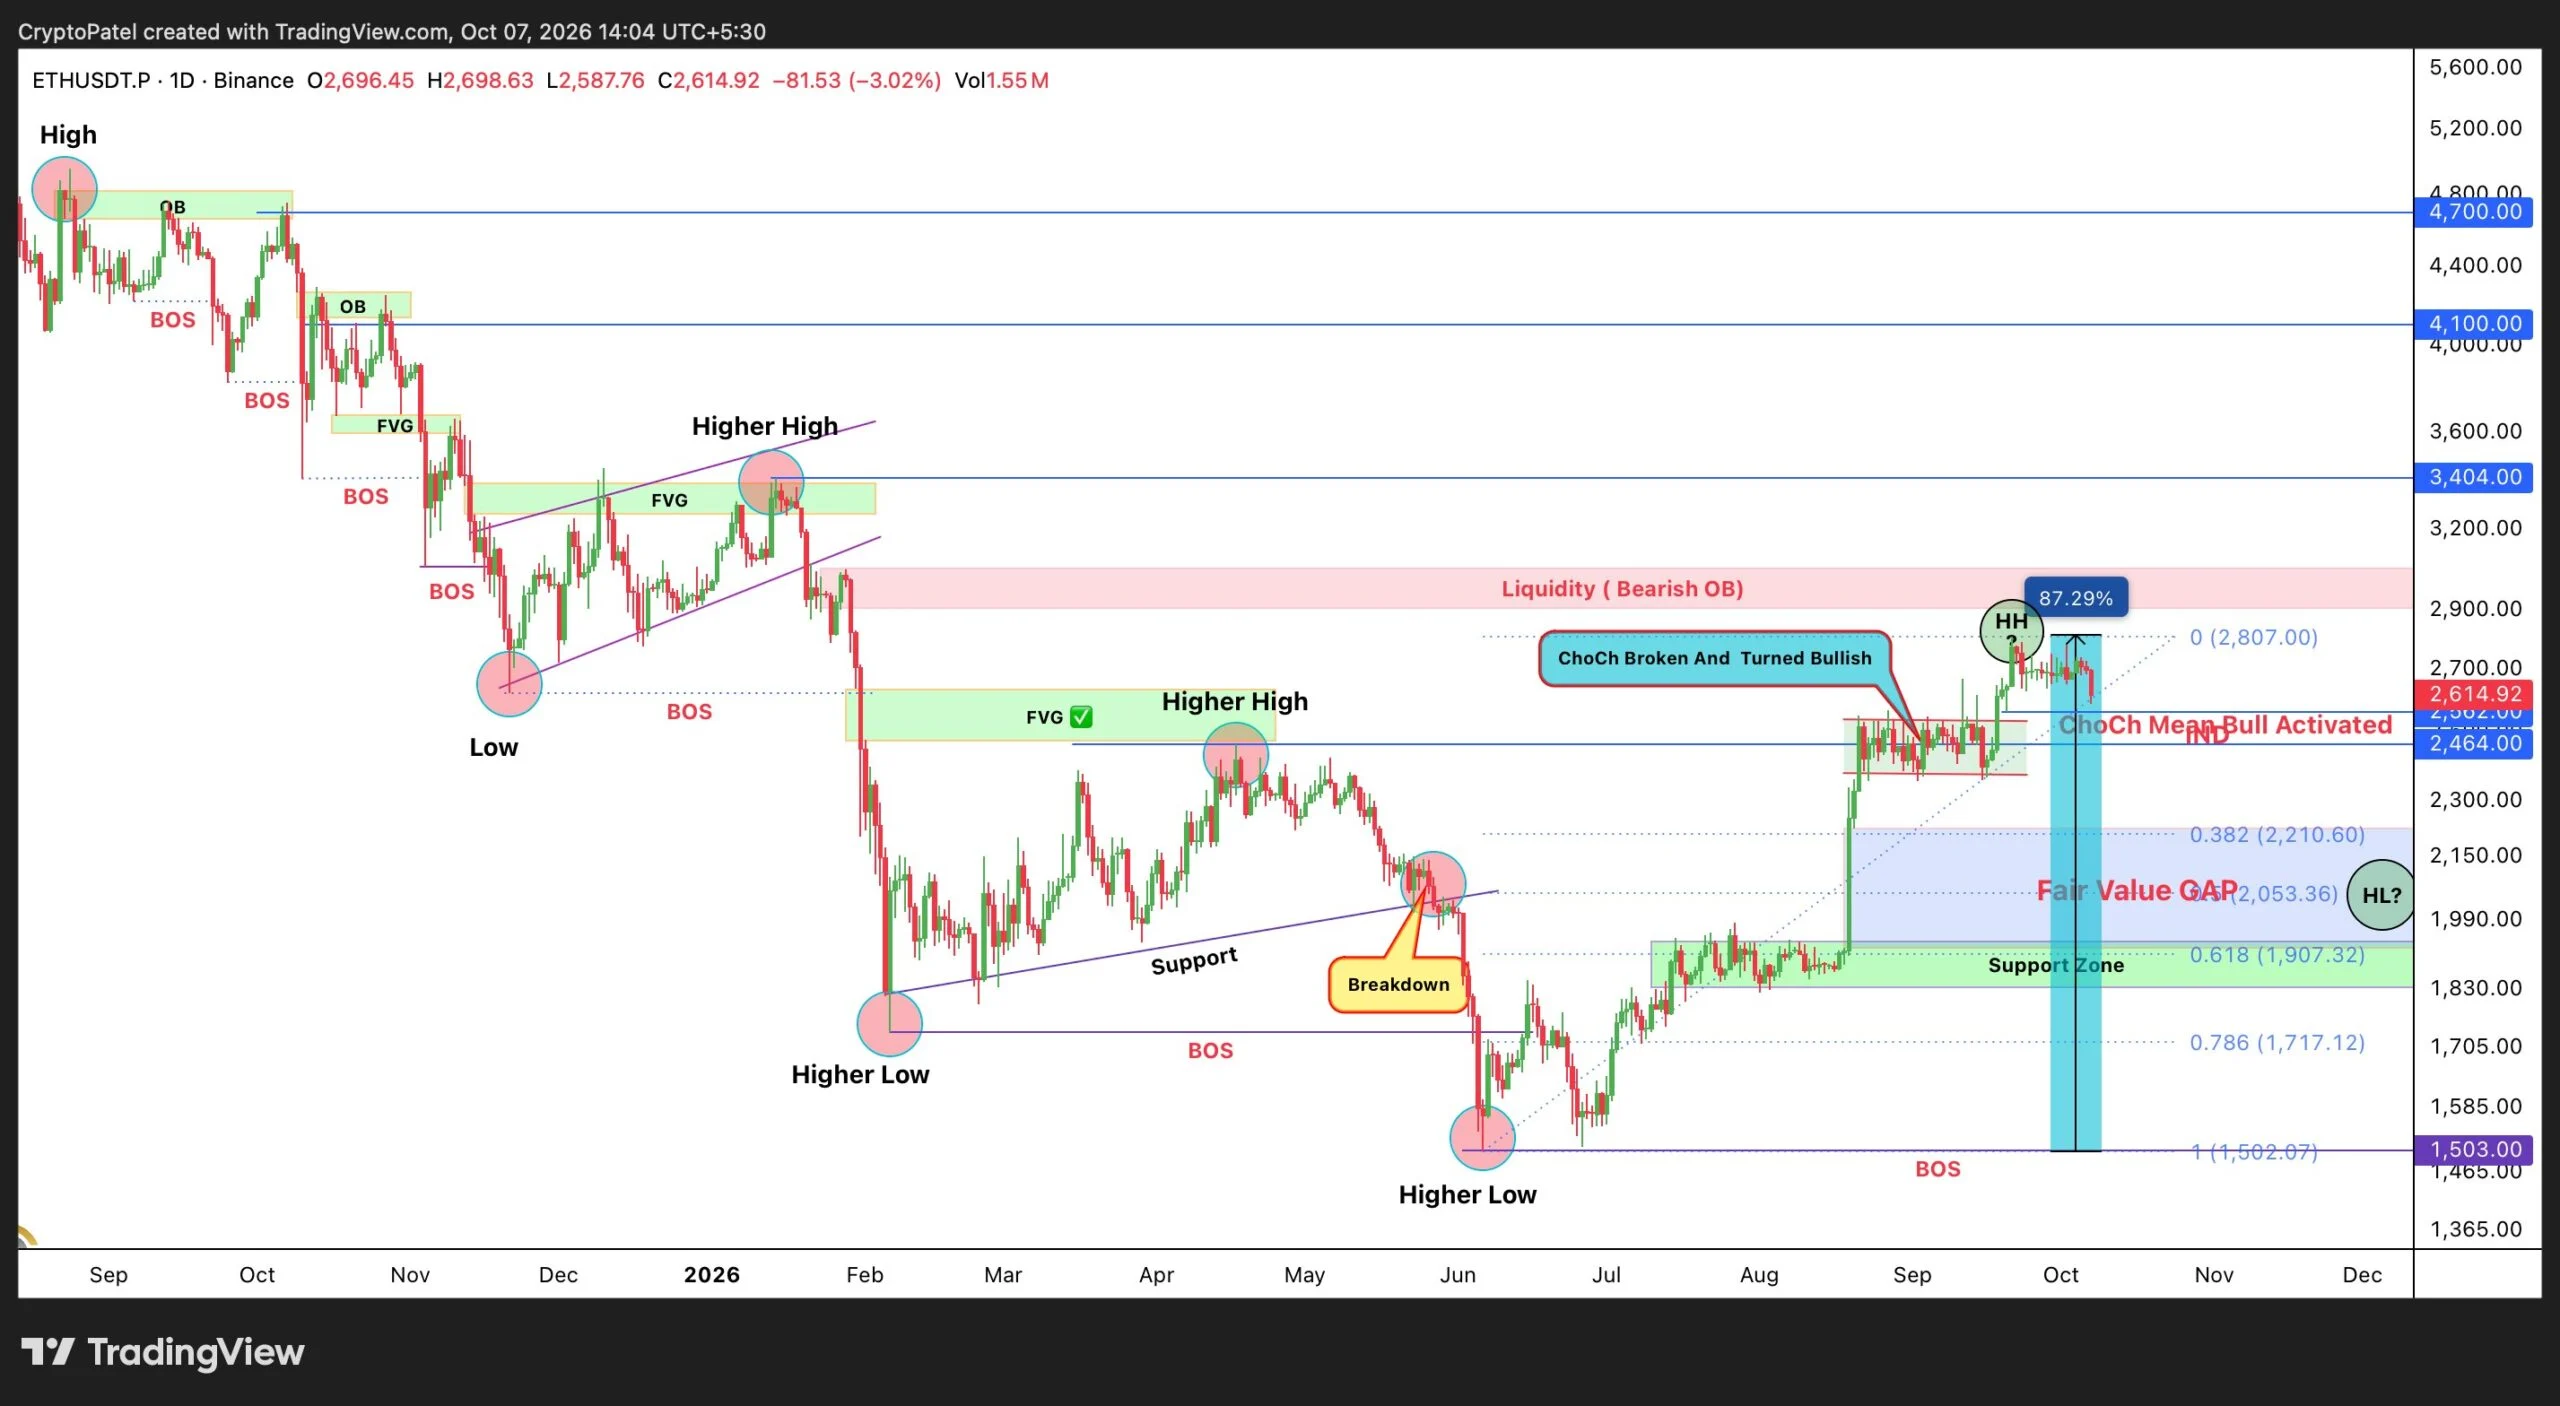
- •Trader Crypto Patel flagged $2,562 as a key decision zone for Ethereum and set a long-term accumulation zone between $2,053 and $1,868, while viewing $5,000 and $10,000 as long-term targets not supported by current data.
- •Solana, trading at $115.85 after a 4.14% daily decline, must lose the $114 support decisively before the $110 target carries technical weight, and reclaiming $120 would weaken the bearish setup.
- •RSI readings forming lower highs while prices stay mostly flat suggest buyers are losing strength, and a decisive range break is expected to confirm the next move.
Ethereum (ETH) fell 5.60% in 24 hours to $2,558.66, according to CoinGecko data, and has now lost 5.86% over the past seven days. Daily trading volume stands at roughly $18.76 billion.
Solana (SOL) trades at $115.85 on CoinGecko, down 4.14% on the day and 4.66% on the week. The parallel weakness has led analysts to ask whether ETH is leading the drop while SOL simply trails it. Both assets rank among the most heavily traded cryptocurrencies, which is why their combined slide tends to draw attention well beyond their own charts.
The moves put a series of technical levels in focus. Ali Charts sees $2,540 and $2,500 as ETH's next visible downside levels after it broke below its channel, while SOL must lose $114 decisively before the110 target carries real technical weight. Reclaiming $120 would weaken the bearish SOL setup, and lower highs on the RSI show buyers losing control, per the analysts' commentary.
Ethereum Price Breaks Below Channel Support
Market analyst Ali Charts says ETH broke below its range channel first. The chart shows ETH near $2,574, with $2,540 and $2,500 as the next visible downside. A move to $2,500 would keep pressure on the broader altcoin market — Ethereum is the largest altcoin by market value, and its chart levels are widely used as a reference point for how traders read the rest of the market.
ETHEREUM LEADS, SOLANA FOLLOWS
I'm starting to wonder whether $ETH is leading the move and $SOL is simply following.
If Ethereum continues toward $2,500 after breaking out of a channel, should we expect Solana to follow with another leg lower?
The levels I'm watching for… pic.twitter.com/XWVFn31oy4
Trader Flags $2,562 as a Key Decision Zone for ETH
Trader Crypto Patel flags $2,562 as a key decision zone. A daily close below that level would shift focus to the next higher low, and Patel does not plan to chase price at that point. Daily closes are the yardstick many technical traders use to filter out intraday noise before calling a level broken.
The trader's accumulation zone sits between $2,053 and $1,868, an area where several signals overlap: the 0.5 to 0.618 Fibonacci retracement, a fair value gap, and a bullish order block. Fibonacci retracements are ratios, drawn from the Fibonacci sequence, that traders use to map potential pullback zones. A fair value gap marks an area where price moved too fast for orders to fill, while an order block marks a level where large buyers previously stepped in.
Patel would treat that zone as a long-term accumulation area only after a bullish market structure shift confirms it, noting that price must show buyers returning first. He also watches the 0.786 Fibonacci level near $1,717 for a sharp liquidity sweep — a fast move through a level where resting stop orders sit. Long-term targets of $5,000 and $10,000 remain the trader's view, not a forecast the current data supports.
Will Solana Follow the Ethereum Price Lower?
Ali Charts shows Solana near $117.25 after losing the $120 area. The first downside target is $114, followed by $110 if selling accelerates. SOL would need to lose $114 decisively before the $110 target carries real technical weight.
The setup has an exit for bulls. Reclaiming $120 would weaken the bearish case, according to the same chart analysis.
Trader Wealthmanager sees a similar picture on the four-hour timeframe. SOL holds the lower end of its range near $117.70, and the Binance chart shows a descending trendline from recent highs.
$SOL is holding the lower end of the range, but the momentum is starting to fade.
RSI continues to form lower highs while price remains mostly flat. This suggests buyers are losing strength.
A break of the range should confirm the next move. pic.twitter.com/5EthDvTMwz
RSI, a gauge of buying momentum, keeps forming lower highs while price stays mostly flat, a pattern that suggests buyers are losing strength. Wealthmanager says a decisive range break will confirm the next move.
The relative setup matters here. ETH has already made the sharper breakdown, while SOL still holds above its key $114 support. That gap leaves room for SOL to lag ETH and then fall harder if ETH keeps sliding.
Solana's 24-hour trading volume of $3.10 billion shows active trading around these levels. CoinGecko now shows SOL at $115.85, already below the levels both analysts cited when they published their charts, though the token still sits above the $114 support.
ETH's reaction around $2,562 and $2,500 may set the tone for SOL. A clean loss of $114 would put $110 in play. These remain analyst views, not guarantees.
Source: Blockonomi

