Ethereum Price Eyes $2,773 as New Addresses Jump 75%
Key Takeaways
- •New daily Ethereum addresses rose about 75% in eight days, from 121,210 on Aug. 8 to 212,560, according to data cited by analyst Ali Martinez.
- •Ethereum's MVRV momentum indicator formed a golden cross, a pattern that preceded previous ETH rallies of 50%, 166%, 74%, and 113%.
- •ETH must first clear resistance between $1,980 and $2,080 before the $2,773 level becomes relevant, and Glassnode URPD data shows the largest supply cluster near $2,773.
- •A break above $2,773 would leave Ethereum roughly 8% below the $3,000 mark.
- •Downside demand sits between $1,840 and $1,880, with further support zones near $1,690, the $1,540 to $1,570 region, and $1,424.
Key Insights
- Ethereum price faces its first major resistance between $1,980 and $2,080.
- New-address data cited by Ali Martinez showed a 75% increase over eight days.
- An MVRV golden cross strengthened the recovery case, with $2,773 standing as the next major target.
Ethereum, the second-largest cryptocurrency by market value, traded near $1,880 as network activity and on-chain indicators pointed to improving momentum, though the signals stopped short of confirming a sustained rally.
Crypto analyst Ali Martinez said new Ethereum addresses rose from 121,210 on Aug. 8 to 212,560 eight days later, an increase of about 75%. ETH also held above an MVRV pricing band near $1,800, while its Market Value to Realized Value momentum indicator recently confirmed a golden cross, a pattern in which a shorter-term moving average climbs above a longer-term one and is typically read as a sign of building momentum.
Those signals strengthened the recovery case, but Ethereum must first clear resistance between $1,980 and $2,080 before the $2,773 level becomes relevant.
Resistance Builds Below $2,000
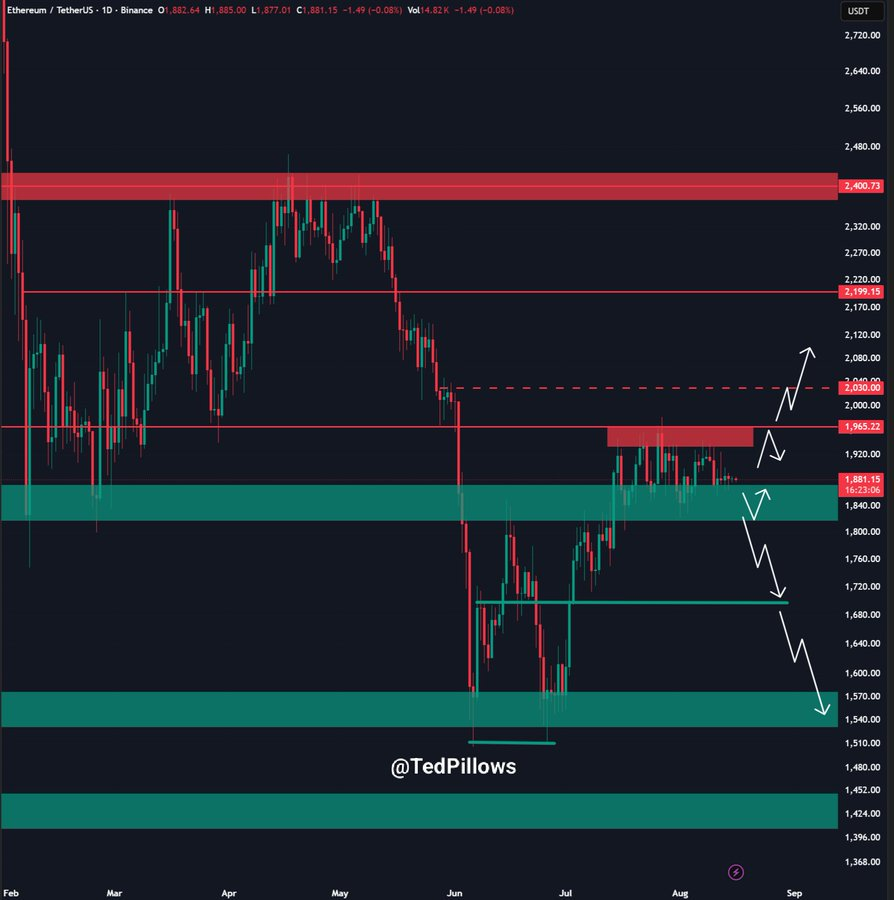
Ethereum trades near a short-term resistance cluster after recovering from the $1,500 area. Analyst Ted Pillows places immediate resistance near $1,965, followed by $2,030. ETH would need to clear both levels before buyers can challenge the next barrier near $2,199.
A larger supply zone sits around $2,400, and a break above that area would strengthen the path toward higher targets. On the downside, the chart shows demand between $1,840 and $1,880. Losing that zone could expose support near $1,690 and the broader $1,540 to $1,570 region. A lower demand zone is also marked near $1,424.
That sequence leaves ETH with several technical barriers to clear before the market can test the $3,000 level.
New Ethereum Addresses Rise to 212,560
Ethereum network growth accelerated sharply over the past eight days. Data cited by Martinez show new daily addresses rising from 121,210 to 212,560, adding more than 91,000 addresses to the daily count in just over one week.
Network growth tracks the number of fresh addresses interacting with Ethereum. Rising address creation can point to broader participation, although it does not confirm immediate buying pressure by itself. Because address activity is visible on Ethereum's public ledger, new-address counts are among the most widely tracked adoption metrics in crypto analysis, though one person can control multiple addresses, so the figures measure network activity rather than unique users. Martinez noted that sustained network growth has often appeared before stronger ETH price periods in earlier market cycles.
The latest move therefore adds an on-chain factor to the current Ethereum price setup. ETH still needs to clear nearby resistance before the market can confirm a stronger trend. For now, the address data shows expanding network participation while ETH attempts to recover from recent weakness.
MVRV Golden Cross Adds to Recovery Case
Ethereum has also moved above the 0.8 MVRV pricing band around $1,800, a level Martinez identified as an important bullish trigger. MVRV compares Ethereum's market value with its realized value, which re-prices the supply at the price each coin held when it last moved; the ratio is widely used to gauge whether the market sits above or below the average holder's cost basis. The MVRV pricing chart places the 0.8 band near $1,796, while higher valuation bands sit much further above the market. The same chart places Ethereum's realized price near $2,245, in effect the aggregate cost-basis level for the ETH supply.
The MVRV momentum indicator has formed a golden cross. Martinez said the previous four signals came before ETH rallies of 50%, 166%, 74%, and 113%. A separate MVRV chart shows the ratio recovering near the one-point threshold after spending time below it.
Supply Zones Stand Between ETH and $3,000
Ethereum still faces several supply zones before $3,000 becomes a realistic technical target. URPD data from blockchain analytics firm Glassnode shows notable concentrations around $1,980, $2,524, and $2,773. The largest visible concentration sits near $2,773, making that level a major hurdle. The URPD chart also shows another holder cluster near $1,733.
URPD, short for Unrealized Realized Profit Distribution, groups circulating supply by the price at which it last moved. Analysts watch clusters above the market as potential resistance because supply acquired at those prices can come back to market when positions return to break-even.
Martinez places the first key resistance range between $1,980 and $2,080. If buyers clear that zone, ETH could move toward $2,773. A break above $2,773 would leave Ethereum price roughly 8% below the $3,000 mark.
Source: The Market Periodical

