Ethereum Falls to $2,060 as Multi-Year Trendline Holds
Key Takeaways
- •Ethereum fell about 6% across two sessions after its rebound stalled at the 200-day simple moving average, and a wick to $2,060 marked the first test from above of a multi-year trendline since August, with the candle closing back above the line.
- •On November 9, ETH traded at $2,117 on Binance after selling emerged around the 200-day SMA at $2,155 and the 0.500 Fibonacci retracement, an area that shifted from support at the start of the month into resistance.
- •The 14-day RSI declined to 32.36, sitting just 2.36 points above the commonly used 30 oversold threshold and below readings recorded before the rebound began.
- •A reclaim scenario requires a daily close above $2,155 and the $2,160 session high, with the 0.382 retracement near $2,307 and the 100-day SMA at $2,373 identified as subsequent levels before the larger $2,469-$2,497 resistance zone.
- •A breakdown scenario would be triggered by a daily close below the trendline near $2,080, potentially exposing the November low at $2,060, the 0.618 retracement near $2,001, the 100-month SMA at $1,837, and the 0.786 retracement near $1,783.
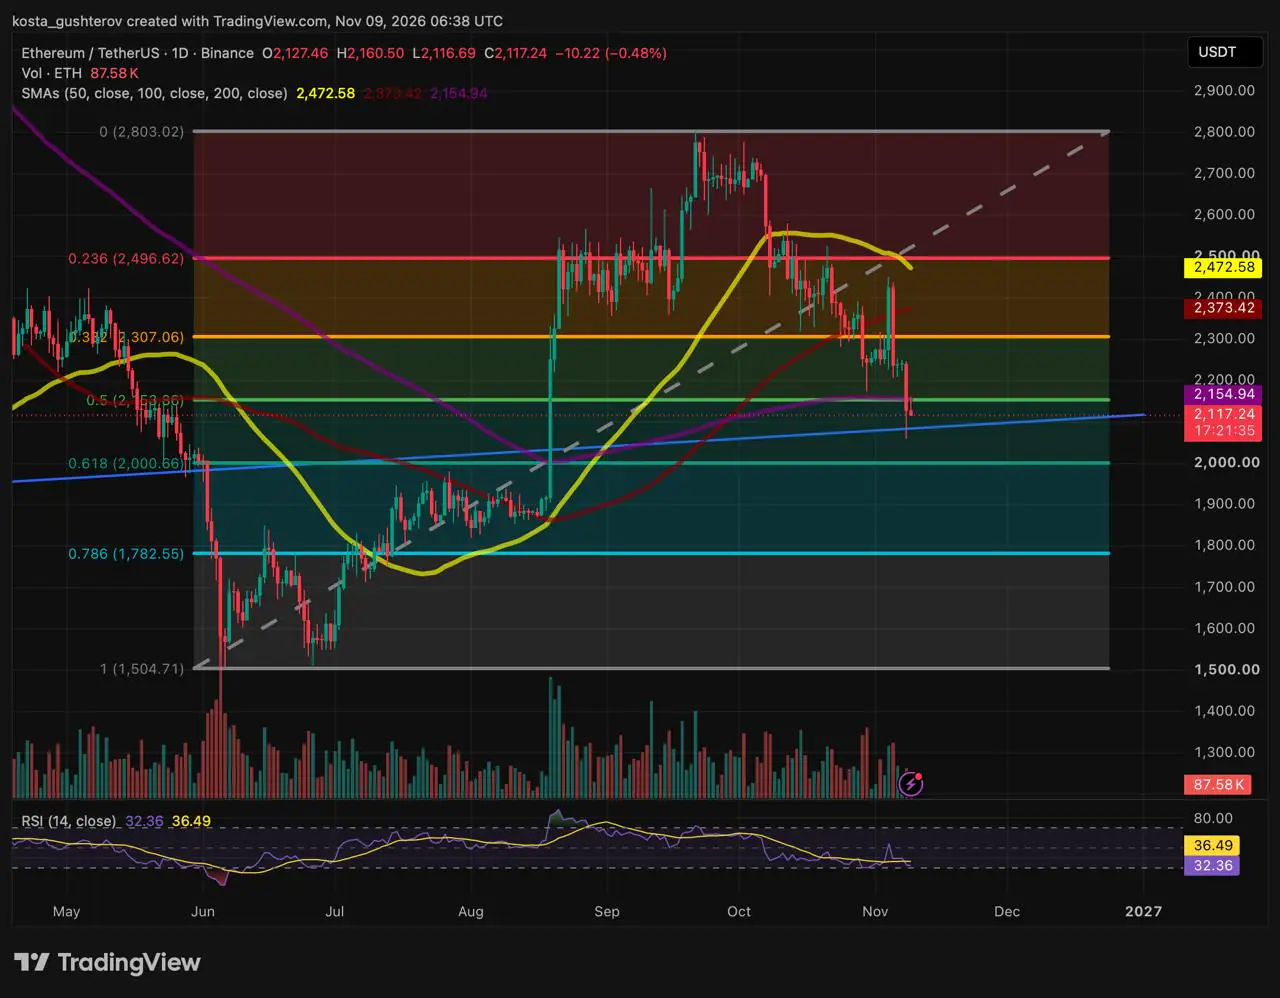
Ethereum fell nearly 6% over two days as its rebound stalled at the 200-day simple moving average (SMA). A wick to $2,060 tested a multi-year trendline, while the daily relative strength index (RSI) declined to 32.36.
Coindoo’s November 4 analysis identified $2,442, nearly 7% above the then-current level, as just below the $2,500 ceiling. It also identified a daily close below $2,226 as the level that would invalidate the rebound. On the Binance daily chart at 06:38 UTC on November 9, ETH traded at $2,117, down 0.48% on the day.
Ethereum is now caught in a narrow range. The 200-day SMA, a widely tracked gauge of long-term trend direction, and the 0.500 Fibonacci retracement level—one of the ratio-based references chartists use to measure how much of a prior move has been given back—are acting as overhead resistance, while the multi-year trendline remains below the market. The source article was published by Coindoo.
ETH moves from $2,450 to the trendline in five sessions
The November 4 candle closed above the 100-day SMA, but the move lasted only one session. On November 5, ETH surrendered that gain and closed below the 0.382 retracement near $2,307. It then held around $2,240 for two days.
On November 8, ETH opened near $2,245 and fell through the $2,226 level identified in the earlier analysis. The decline moved through both the 0.500 Fibonacci level near $2,154 and the 200-day SMA. ETH reached as low as $2,060 before closing at $2,127.
The 200-day SMA caps the rebound
The November 9 session opened at $2,127 and rebounded to $2,160, a few dollars above the 200-day SMA at $2,155 and the 0.500 retracement level. Those two levels were about a dollar apart. Selling emerged there, pushing ETH back to $2,117, the session low at the time of the analysis.
The same area had served as support at the turn of the month. Coindoo’s November 1 analysis identified a bounce from that cluster. On November 9, however, the area acted as resistance on the first retest from below. Support-to-resistance flips of this kind, often described as role reversal, are a standard concept in technical analysis, and the first retest of a broken level is commonly watched for confirmation that the break has taken hold.
Trendline receives its first test since August
The trendline beneath the price runs from early 2021 through the 2022 bear-market lows near $1,000. ETH tested the line again in 2025 and had traded above it since mid-August. Trendlines drawn across multiple years connect price extremes spanning entire market cycles, which is why chart analysts tend to treat tests of such lines as reference points for longer-term structure rather than single-session events.
November 8 marked the first test from above since that period. The wick to $2,060 pierced the trendline, but the candle closed back above it. The gap between the upper and lower boundaries of the squeeze was about $75, or 3.5%.
Momentum gives back the rebound
The 14-day RSI stood at 32.36, below its signal line at 36.49 and 2.36 points above the 30 level commonly used to indicate oversold conditions. The RSI had risen to 55.57 on November 4. The November 9 reading was also below the 33.83 recorded on November 1, before the rebound began.
The monthly RSI was less extended at 46.08, just below its signal line at47.07 and near the midpoint of its range.
The moving averages above the price have also tightened around the resistance area. On the monthly chart, November was down 6.15%, and the month’s $2,450 high stopped just below the 50-month SMA at $2,469.
That level is close to the daily 50-day SMA at $2,473 and the 0.236 Fibonacci retracement near $2,497. The daily and monthly charts therefore share a resistance zone between approximately $2,469 and $2,497, which has limited rebounds since October.
The 50-day SMA is declining toward the 100-day SMA, which has continued rising to $2,373. The gap between the two moving averages narrowed by about one-third in five days.
The trendline does not guarantee a reversal
ETH has broken below this trendline before. June and July of this year both closed below it on the monthly chart, and the August rally was needed to reclaim it. The November 9 rebound also stalled at its first resistance area, with the analysis noting that selling remained active above $2,150.
Reclaim or breakdown scenarios
The two scenarios described in the analysis each begin with a daily close beyond one boundary of the current squeeze. The emphasis on daily closes is deliberate: they filter out intraday extremes such as the November 8 wick to $2,060, which pierced the trendline without producing a close below it.
Reclaim route
Trigger: A daily close above $2,155 and the session high of $2,160.
If the trendline continues to hold while RSI remains near 30, a close back above the 200-day SMA could turn the November 8 break into a failed breakdown. The analysis identifies the 0.382 retracement near $2,307, about 9% higher, and the 100-day SMA at $2,373 as potential levels in that move. The $2,469-$2,497 resistance zone shared by the daily and monthly charts would remain the larger hurdle.
Breakdown route
Trigger: A daily close below the trendline near $2,080.
A close below the line could first expose the November low at $2,060, followed by the 0.618 retracement near $2,001 and the $2,000 level, approximately 5.5% below the current price. Below those levels are the 100-month SMA at $1,837 and the 0.786 retracement near $1,783.
For the trendline, the November monthly close is the most important reference because the line was drawn on that timeframe. More than three weeks remained in the month at the time of the analysis. In April 2025, ETH spent part of the month well below the line but still closed above it.
The levels and scenarios are based on technical analysis of public chart data and do not guarantee future price movements. This article is for informational purposes only and is not financial or investment advice. Cryptocurrencies are volatile, and readers should conduct their own research before making trading or investment decisions.

