Ethereum Surges Toward $2,000 as ETF Inflows and Whale Buying Accelerate
Key Takeaways
- •Ethereum ETFs recorded $244.94 million in weekly inflows, marking the strongest weekly total in almost four months and pushing cumulative net inflows to $11.46 billion.
- •Two whale addresses accumulated a combined 80,000 ETH valued at approximately $152 million, while the Whale Sentiment Index held above 60 for two consecutive days.
- •A long-term holder sold 7,323 ETH for $13.96 million, realizing a $6 million loss after holding since 2022 and 2023 at an average purchase price of $2,723.
- •Analyst Ali Charts reported two TD Sequential buy signals on Ethereum's monthly chart, suggesting potential upward momentum toward $3,000 if confirmed.
- •The U.S. Senate opened the first voting stage on the CLARITY Act, which would establish a federal framework distinguishing digital assets as securities or commodities and needs 60 votes to advance toward a September vote.
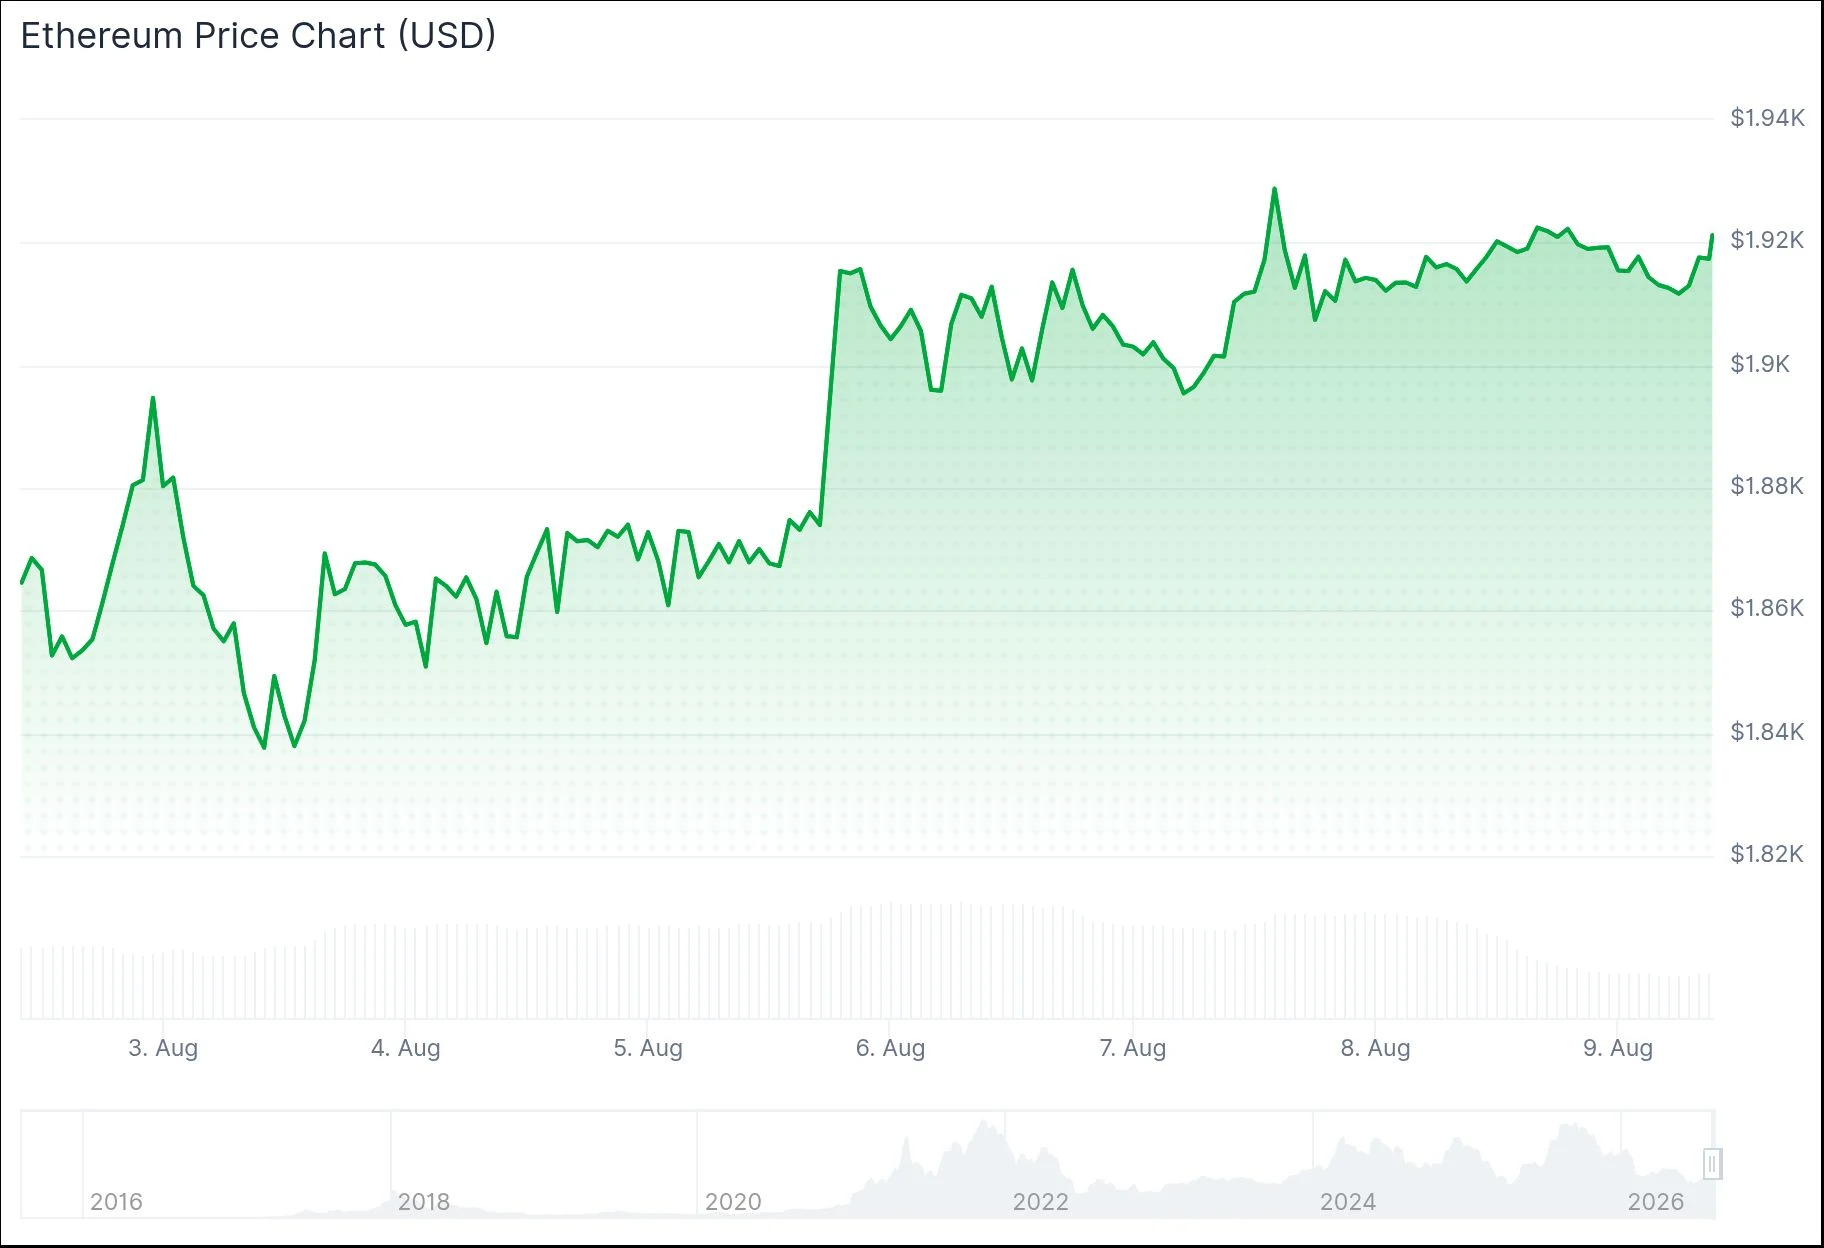
Ethereum is trading near $1,923, up about 1% over the past 24 hours, after rebounding from $1,820 last week and moving within an ascending channel through August.
Ethereum exchange-traded funds recorded $244.94 million in weekly inflows, the strongest weekly total in nearly four months. Cumulative net inflows now stand at $11.46 billion, while weekly trading volume reached $2.38 billion. U.S. spot Ethereum ETFs, which began trading in July 2024, have become a key channel for traditional investors seeking ETH exposure without holding the asset directly, making sustained inflow trends a closely watched gauge of institutional appetite.
Analyst Ted (@TedPillows) highlighted the figures on X, writing: “$ETH ETFs bought $244,940,000 in Ethereum this week. Largest weekly inflow in almost 4 months.” The data suggests renewed institutional demand after weaker inflows earlier in the year.
$ETH ETFs bought $244,940,000 in Ethereum this week. Largest weekly inflow in almost 4 months. pic.twitter.com/h5WLpv4j0p — Ted (@TedPillows) August 8, 2026
Weekly inflows had already been building in recent weeks. Flows reached $105.44 million on July 17 and $103.90 million on July 24 before accelerating further in August.
Bitcoin ETFs also recorded $98.85 million in net inflows on August 7, extending a five-day positive streak. Spot Ethereum ETFs added $49.60 million on the same day, keeping a four-session inflow streak alive.
Whale activity adds support
Large-holder activity also pointed to strong demand. Two whales accumulated a combined 80,000 ETH worth $152 million. One whale withdrew 30,000 ETH worth $57.21 million from Coinbase Prime and distributed it across three new wallets. A second whale acquired 50,000 ETH worth $95.73 million from a Fidelity-linked wallet.
Ethereum's Whale Sentiment Index remained above 60 for two days and stayed above 50 for six consecutive days. It currently sits near 66, indicating heavy buying by large holders.
Not all large holders were buyers. One long-term whale sold 7,323 ETH for $13.96 million, locking in a $6 million loss. The wallet had held ETH since February 2022 and March 2023, with an average purchase price of $2,723.
Technical indicators point to key levels
Analyst Ali Charts (@alicharts) said on X that Ethereum's monthly chart flashed two TD Sequential buy signals last month: a black 9 and an S13. He noted that TD Sequential signals on the monthly chart over the past four years have accurately identified ETH's trend, citing prior calls that preceded a -75% drop in April 2022 and a +236% rally in September 2022. He suggested the latest signals could support a move toward $3,000 if they are confirmed again.
ETHEREUM: TWO MONTHLY BUY SIGNALS Last month, the TD Sequential flashed two buy signals on Ethereum's monthly chart: a black 9 and an S13. This is a macro bullish development worth paying attention to. Over the past four years, every TD Sequential signal on the monthly chart… pic.twitter.com/iY9FmmxOxK — Ali Charts (@alicharts) August 8, 2026
From a technical perspective, ETH's relative strength index is at 61.03, which places it in bullish territory without being overbought. The MACD line at 10.31 is slightly above the signal line at 9.85, and the histogram is positive at 0.46.
Ethereum is trading above its 20-day and 50-day moving averages and is testing the 100-day moving average. A break above that level could open the way toward the 200-day EMA at $2,147.
A sustained move above $1,920 would put $1,960 into focus, followed by the $2,000 level. If ETH is rejected at $1,920, initial support is seen at $1,880, followed by $1,860.
CLARITY Act advances in the Senate
On August 8, the U.S. Senate opened the first voting stage on the CLARITY Act, a bill designed to establish a federal framework clarifying whether digital assets are regulated as securities or commodities, drawing jurisdictional lines between the SEC and CFTC. The bill still needs to clear a 60-vote threshold before it can move toward a September vote. Market participants have closely tracked the legislation, as a clearer regulatory designation for assets like ETH could reduce legal uncertainty that has constrained institutional participation in the sector.

