Canton (CC) Surges 15% as Price Approaches Key Fibonacci Resistance
Key Takeaways
- •CC rose approximately 15% over two sessions to an intraday high of $0.102 before retreating toward $0.098, with the bounce attributed primarily to relief from oversold conditions rather than any specific catalyst.
- •The token continues to trade below its 50-day, 100-day, and 200-day simple moving averages, meaning the broader daily downtrend remains intact despite improved short-term momentum.
- •The 0.236 Fibonacci retracement near $0.107 serves as the first significant technical resistance level, followed by heavier resistance around $0.13 where the 0.5 retracement converges with the 50-day SMA.
- •Canton operates a burn-and-mint tokenomics model, so the approximately $57.7 million in July chain revenue does not guarantee a net reduction in CC supply because validators and application providers can mint new coins.
- •A drop below $0.093 would expose the recent $0.087 low, and a decisive break beneath that level would invalidate the current Fibonacci retracement structure.
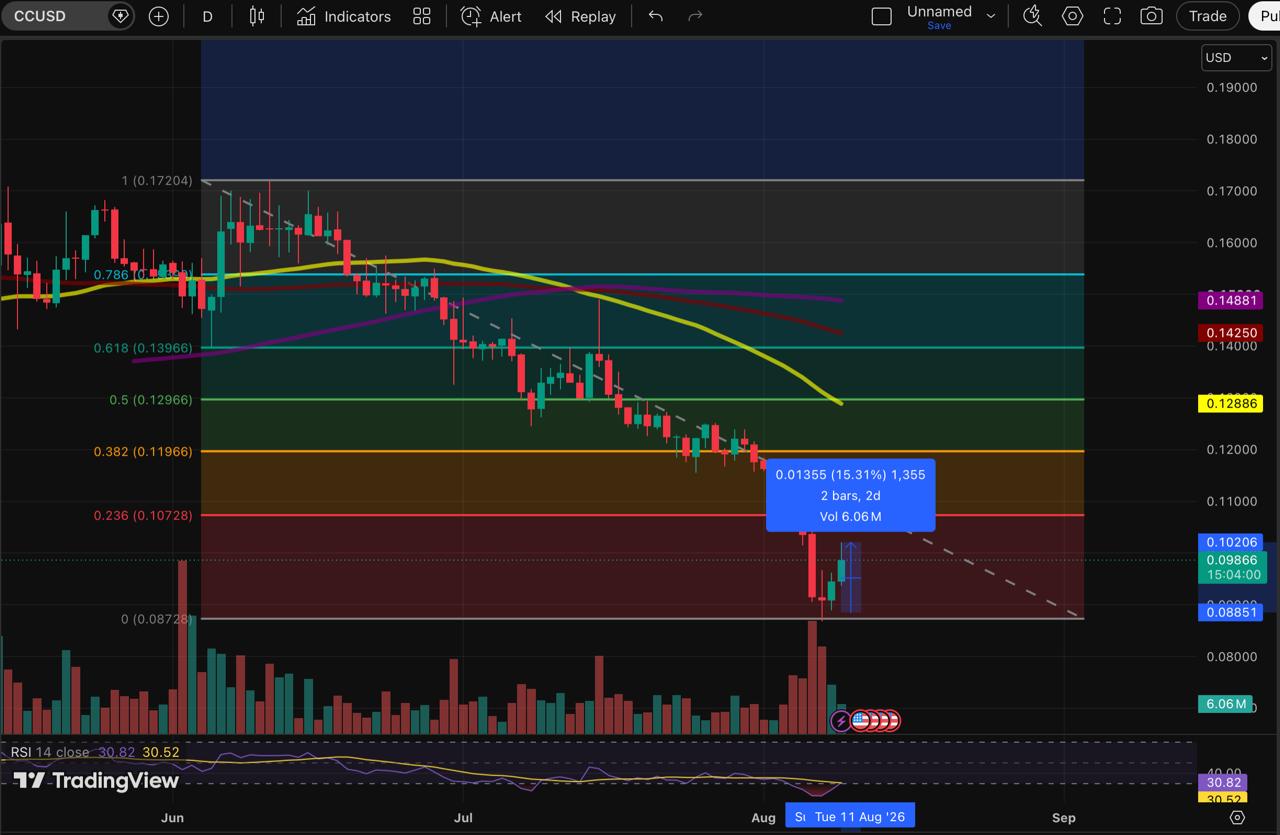
Canton's native token CC climbed as much as 15% over two sessions, reaching an intraday high of $0.102 before easing toward $0.098 at the time of writing. The rebound has improved short-term momentum, though the token now faces its first significant technical resistance while trading below every major daily moving average.
Key Takeaways
- The rebound has improved short-term momentum without reversing the broader daily downtrend.
- The 0.236 Fibonacci retracement near $0.107 marks the first clear technical hurdle.
- Recent Canton ecosystem developments may support sentiment, but none directly explains the timing of the rally.
- A decline below $0.093 would put the recent low back under pressure.
A 15% Bounce Within a Larger Downtrend
CC reversed sharply after touching $0.087, rising to just above $0.102 over the following two sessions. Daily RSI had fallen deep into oversold territory during the selloff and remains close to 30 even after the recovery. With selling pressure already stretched to that degree, easing pressure alone was sufficient to produce a strong relief move.
The broader trend, however, still favors sellers. CC remains below its 50-day SMA at approximately $0.128, the 100-day SMA near $0.142, and the 200-day SMA around $0.148. This leaves a substantial gap between the current price and the levels that would begin to repair the daily chart structure. The bounce has shifted short-term momentum but has not altered the larger downtrend.
$0.107 Fibonacci Level Comes Into Focus
The 0.236 Fibonacci retracement sits near $0.107. Today's high of $0.102 came within approximately 5.1% of that level, making it the first clear hurdle for buyers looking to extend the rebound. CC has already produced a double-digit move over two sessions, so an additional 5% advance would not be unusual given its recent volatility. Whether the token can reach that level will depend on whether buyers maintain sufficient volume and absorb selling pressure above $0.10.
A break through $0.107 would bring the 0.382 Fibonacci retracement near $0.12 into view. Resistance becomes considerably heavier beyond that point. The 0.5 retracement sits around $0.13, almost directly alongside the 50-day SMA near $0.128, creating a confluence that forms a much stronger barrier than the first Fibonacci level. The 0.618 retracement near $0.14 would then place CC back into the zone occupied by the longer-term daily moving averages.
No Single Catalyst for the Rally
No recent announcement aligns closely enough with the two-day price move to explain the rally on its own. Bitrue opened CC/USDT spot trading on August 4, with withdrawals following on August 5. The exchange also launched a promotional campaign around the listing. While the addition of another spot venue broadens access to CC and provides an additional source of liquidity and price discovery, the listing preceded the rebound by several days, making it better suited as background context for improved market access rather than a direct trigger for the latest price candles.
Institutional activity around Canton has also continued. On August 4, 1exchange announced that it had become an approved validator on Canton. The Singapore-regulated market operator plans to use the network for future real-world asset tokenization, listings, and secondary trading.
This followed a broader milestone in July, when DTCC reported that tokenized assets had been used in production transactions across Canton and its private network ahead of the planned October launch of its Tokenization Service. DTCC, which settles the vast majority of US securities transactions, is part of a wider institutional presence around the network that also includes Goldman Sachs, as examined in a prior analysis of why major financial institutions are building around Canton. Canton's architecture is designed specifically for institutional financial markets, offering privacy controls and cross-chain interoperability that distinguish it from public, permissionless blockchains.
Collectively, these developments strengthen Canton's institutional narrative. The price action itself, however, appears more immediately consistent with a rebound from deeply oversold conditions than a reaction to any single announcement. The October launch of DTCC's Tokenization Service is a concrete milestone to monitor, as broader adoption on the network could influence CC's fundamental profile over time.
Fee Burn Figures Require Context
Canton's recent network-fee figures add another fundamental dimension, but they should not be interpreted as a straightforward measure of token deflation. DeFiLlama tracks approximately $57.7 million in Canton chain revenue for July, reflecting fees generated through network activity. The effect on CC supply depends on what occurs after those fees are paid.
According to Canton's official tokenomics documentation, the network operates under a burn-and-mint model. CC used for network activity can be burned, while validators, Super Validators, and application providers can mint new coins for their contributions. Burning therefore does not automatically translate into an equivalent permanent reduction in supply, as issuance must be considered alongside it.
What the July figure does demonstrate is substantial economic activity flowing through the network. If that activity persists or expands, it could matter more to CC's long-term economics than a short-lived increase in speculative trading.
Levels That Would Invalidate the Rebound
A decline back below today's low near $0.093 would be the first sign that the recovery is losing momentum and would expose the recent $0.087 low again. A decisive break beneath $0.087 would establish a fresh low in the ongoing decline and invalidate the current Fibonacci setup, which uses that level as its lower anchor. At that point, a new swing low would be needed before a reliable retracement structure could be drawn from the next recovery attempt.
Methodology: The analysis uses the CC/USD daily chart, Fibonacci retracement levels, 50-day, 100-day, and 200-day simple moving averages, volume, and RSI. Fundamental context is drawn from Bitrue, Canton Network, DTCC, Canton documentation, and DeFiLlama. Fundamental developments are used as market context rather than evidence of direct price causation.
Disclaimer: This article is provided for informational and educational purposes only and does not constitute financial or investment advice. Cryptocurrency markets are highly volatile, and technical levels or fundamental developments may fail to produce the expected price reaction.
Source: Coindoo

