Ethena (ENA) Consolidates Near $0.09 as Analysts Watch for Breakout Above $0.10
Key Takeaways
- •ENA is trading at $0.08947 with a market capitalization of $879.38 million and has declined 1.38% over the past week.
- •Analyst Crypto With Gopal identified a rectangular consolidation pattern between $0.070 and $0.098, with a breakout above $0.098–$0.100 potentially targeting $0.13.
- •ENA futures open interest increased 2.81% to $230.85 million while futures volume declined 7.99% to $198.44 million.
- •The token is trading above its 20-day and 50-day exponential moving averages but remains below its 100-day and 200-day EMAs, indicating mixed technical signals.
- •Analyst Lana Valentis characterized levels below $0.10 as accumulation territory, listing potential price objectives ranging from $0.13 up to $1.35, though confirmation is still required.
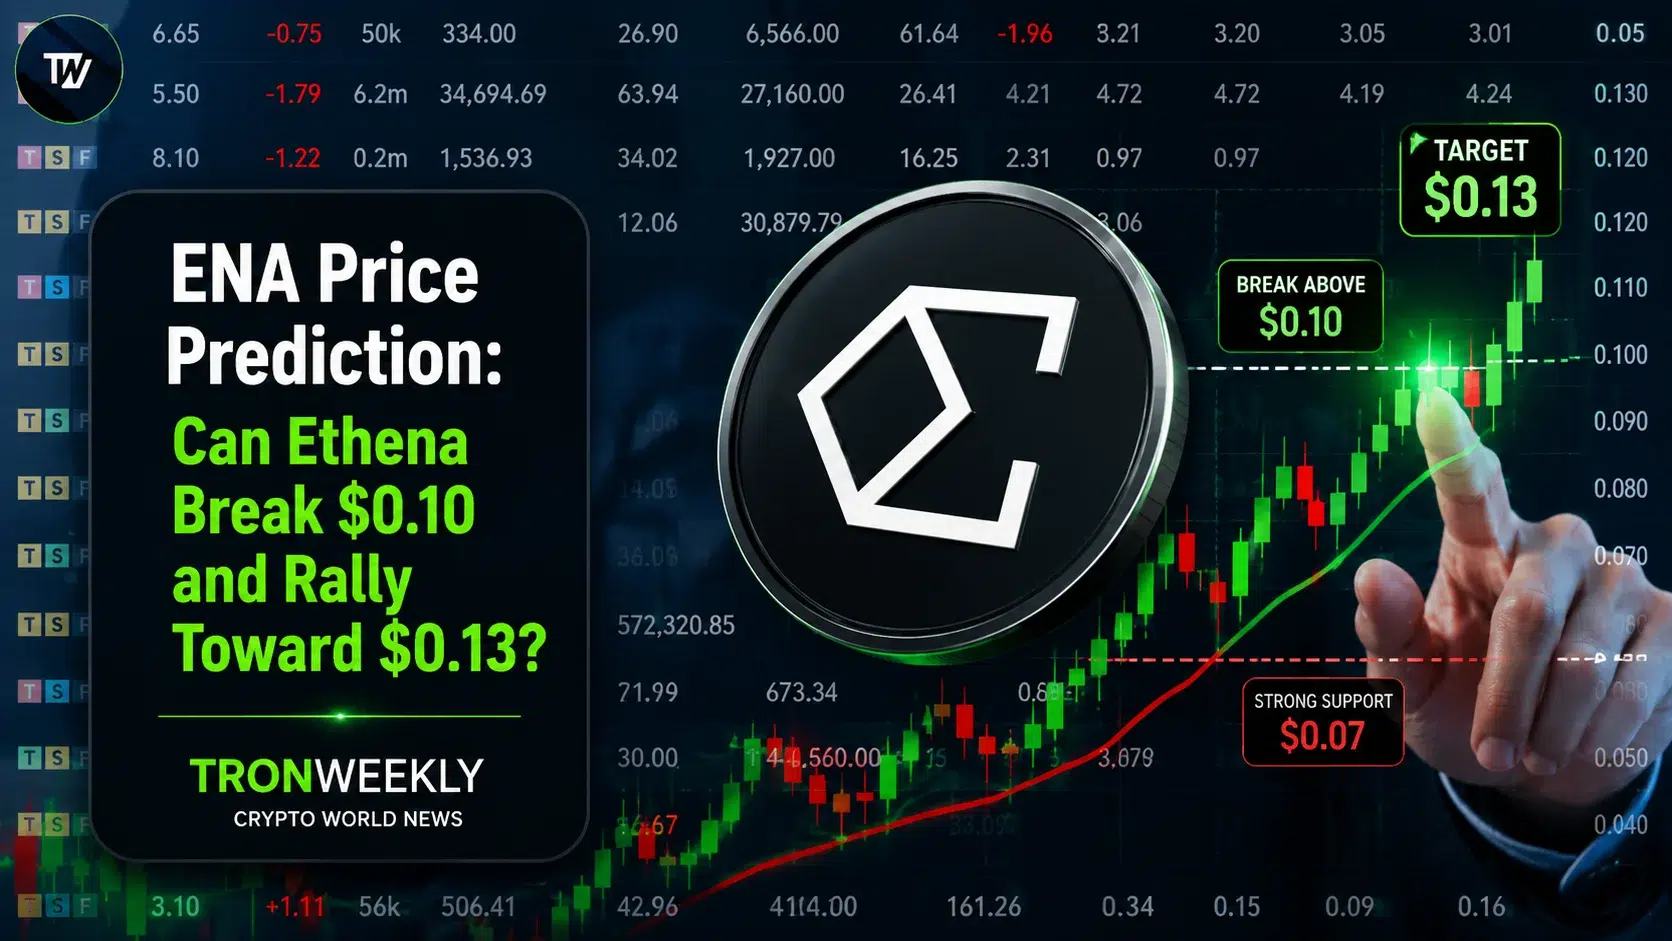
Ethena (ENA) is showing signs of a potential breakout as of Tuesday, August 11, 2026, with analysts closely monitoring key resistance and support levels. The token has been consolidating within a defined range, and technical indicators suggest that buyers are attempting to sustain upward momentum. For traders watching the chart, the current setup is notable because ENA is sitting near the middle of a price band that has repeatedly acted as a decision zone in recent sessions.
According to CoinMarketCap, ENA is currently trading at $0.08947, reflecting a modest daily increase of 0.17%. Trading volume stands at $102.72 million, while the token's market capitalization is $879.38 million. Over the past week, the coin has declined by 1.38%, underscoring that the broader trend remains mixed even as short-term momentum improves.
Analyst Identifies Rectangular Consolidation Pattern
Analyst Crypto With Gopal noted that ENA is consolidating within a rectangular formation on the four-hour chart, with the price oscillating between approximately $0.070 and $0.098. The token is currently trading near $0.090 within this range.
Gopal indicated that a breakout above the $0.098–$0.100 region would signal the formation of a bullish trend, with a potential target of $0.13. Such a move would represent a decisive break from the current consolidation pattern and would place the token above a level that has capped recent advances.
Conversely, a breakdown below $0.070 would invalidate the bullish formation, potentially opening the path to a lower target of $0.04. Gopal identified $0.070 as the most critical level for this setup.
Second Analyst Points to Accumulation Territory
Independent analyst Lana Valentis stated that ENA appears positioned for a significant move, describing the token as forming a consolidation pattern above a small descending channel on the weekly chart. Valentis noted that this formation resembles a previous pattern that preceded a sharp price increase.
Valentis characterized levels below $0.10 as accumulation territory, though she emphasized that confirmation is still required. Her analysis listed potential targets at $0.13, $0.25, $0.47, $0.87, and $1.35, presented as price objectives rather than confirmed outcomes.
Futures Market Shows Rising Open Interest
CoinGlass data reveals that ENA futures volume declined by 7.99% to $198.44 million, while open interest increased by 2.81% to $230.85 million. The OI-weighted funding rate stands at 0.0046%, indicating continued market participation even as trading activity slows. In practical terms, rising open interest alongside lower volume often means positions remain active while the market waits for a stronger directional catalyst.
Technical Indicators Paint a Mixed Picture
According to TradingView, the 20-day exponential moving average (EMA) is positioned at $0.0874, and the 50-day EMA stands at $0.0864. Both short- and medium-term averages sit below the current price of approximately $0.0894, placing ENA above these key levels on the daily chart.
However, the 100-day EMA remains above the current market price at $0.0931, and the 200-day EMA is notably higher at $0.1304. These longer-term moving averages continue to hover above ENA and serve as the next significant reference points.
The Bollinger Bands indicator shows an upper band at $0.0965, a middle band at $0.0871, and a lower band at $0.0777. The current price sits above the middle band but below the upper band, placing ENA within the range defined by the indicator.
This article contains market analysis and price predictions based on technical indicators. These are not guarantees of future performance. Cryptocurrency markets are highly volatile.

