Interest Rates, Silver, and Gold: Key Elliott Wave Counts and Price Targets
Key Takeaways
- •The analysis adopts an alternate Elliott Wave count for U.S. 10-year Treasury yields, identifying wave (iv) as a bullish triangle with a minimum price target at the wave *a* low of 3.886%.
- •A significant medium-term decline in interest rates is projected, which could reduce the opportunity cost of holding gold and act as a catalyst for the next major rally in the metal.
- •Silver's current wave structure offers two scenarios: either wave iv has completed at 54.77 and a rally is underway, or wave 3 is extending, which would project silver prices well above $300.
- •Gold has entered a multi-month wave (iv) correction following its peak at 5,595.40, with Fibonacci projections for the end of wave 3 ranging from 5,936.00 to 9,033.60.
- •The analysis maintains long positions across all three markets, using put options as protective stops on silver and gold holdings.
Interest Rates, Silver, and Gold: Key Elliott Wave Counts and Price Targets
In a technical analysis published on GoldSeek, Captain Ewave — the Elliott Wave analysis service operated by professional engineer Gary Kalynchuk — outlined updated wave counts and price projections for U.S. interest rates, silver, and gold. Elliott Wave theory, developed by Ralph Nelson Elliott in the 1930s, identifies recurring five-wave impulse and three-wave corrective patterns in financial markets, with Fibonacci ratios commonly applied to project termination points and price targets across multiple timeframes.
U.S. Interest Rates
According to the daily U.S. rates chart, wave (i) remains underway. Within wave (i), the following sub-waves have been identified:
- Wave (i) completed at 1.266%
- Wave (ii) completed at 0.504
- Wave (iii) completed at 4.997%
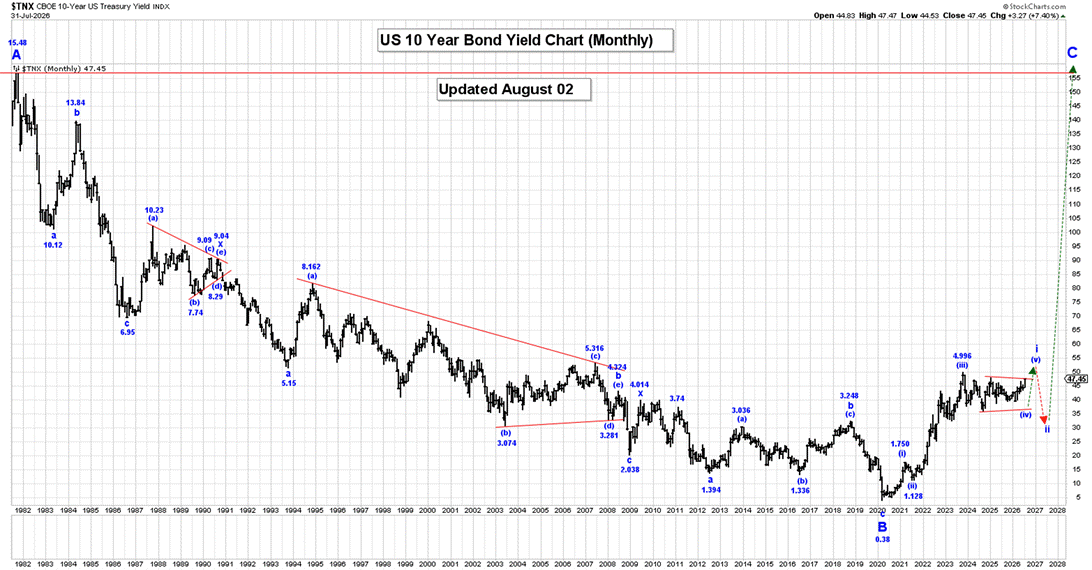
An alternate count has now been adopted, suggesting that wave (iv) is forming an expanding and extending bullish triangle, as shown on the Daily 10-Year U.S. Bond Yield Chart. The minimum target for the end of wave c is the wave a low of 3.886%.
The analysis indicates that a significant dip in rates could occur in the medium term, which may serve as a catalyst for the next major gold market rally. The 10-year Treasury yield is one of the most closely watched global benchmark rates, and because gold generates no yield, declining rates traditionally reduce the opportunity cost of holding the metal, often strengthening its appeal relative to interest-bearing assets.
Active Position: Long, risking to 3.880%.
Silver
On the daily silver price chart, wave iii ended at the 121.65 high, followed by a multi-month wave iv correction. The 61.8% Fibonacci retracement level for this correction is 57.32.
Two scenarios are presented for silver's current structure:
- All of wave iv may have completed at the 54.77 low, with a rally already underway in wave v of 3.
- Alternatively, wave 3 may be extending, meaning only wave i of 3 ended at the 121.56 high and wave ii likely ended at the 54.77 low. Under this interpretation, silver would be heading well above the $300 level in wave iii of 3.
Long-Term Silver Wave Count
In the very long term, the analysis identifies the following completed waves:
- Wave III completed at 49.00 in 1980
- Wave IV completed at 3.55 in 1993
Silver is now in wave V, with the following internal count:
- Wave 1 = 49.56
- Wave 2 = 11.64
- Wave 3 projection updated to 3 = 2.618 × (1) = 132.09
Silver typically exhibits a strong positive correlation with gold but is known for wider percentage swings, meaning its wave projections and corrections often carry magnified amplitude relative to the yellow metal.
Active Position: Long via PSLV:TSX and silver futures, with put options as stops.
Gold
On the weekly and daily gold price charts, wave (iii) completed at the 5,595.40 high. Gold is now in a multi-month wave (iv) correction, with the next 50% Fibonacci retracement level at 3,702.80.
Within wave (iv), the analysis does not rule out the possibility that the entire correction completed at the 3,944.20 low. If wave (iv) develops into a large bullish triangle, it would consist of five legs, and the price would not return to the wave -a- low before the correction ends.
Gold Price Projections
Projections for the end of wave 3:
- 3 = 2.618 × (1) = 5,936.00
- 3 = 4.236 × (1) = 9,033.60
Active Position: Long gold futures, with put options as stops.
Source: GoldSeek | Analysis by Captain Ewave (captainewave.com)
Note: CaptainEwave.com states that it is an impersonal advisory service and that all material presented is for general informational purposes only, not investment advice. The service is not registered as a securities broker-dealer or investment advisor with the U.S. Securities and Exchange Commission or any state securities regulatory authority.

