Dogecoin (DOGE) Eyes Major Breakout as Whale Wallets Accumulate $112M
Key Takeaways
- •Dogecoin rose about 1.4% to trade near $0.0985, testing a resistance zone around $0.098 where roughly 28 billion DOGE previously changed hands.
- •The cryptocurrency has held an ascending support trend line since bottoming near $0.069 in August, with a key horizontal support level at $0.0792.
- •Momentum indicators show strengthening buying pressure, with the RSI at 62.94 and the MACD main line near 0.0039 above its signal line at about 0.0030.
- •Analyst Ali Charts reported that large holders purchased more than 1.14 billion DOGE, worth roughly $112 million, over the past 96 hours.
- •Bulls must first clear the $0.10 threshold to reach the $0.1174 resistance from the May advance, while a decisive close below $0.0792 would undermine the higher-low structure.
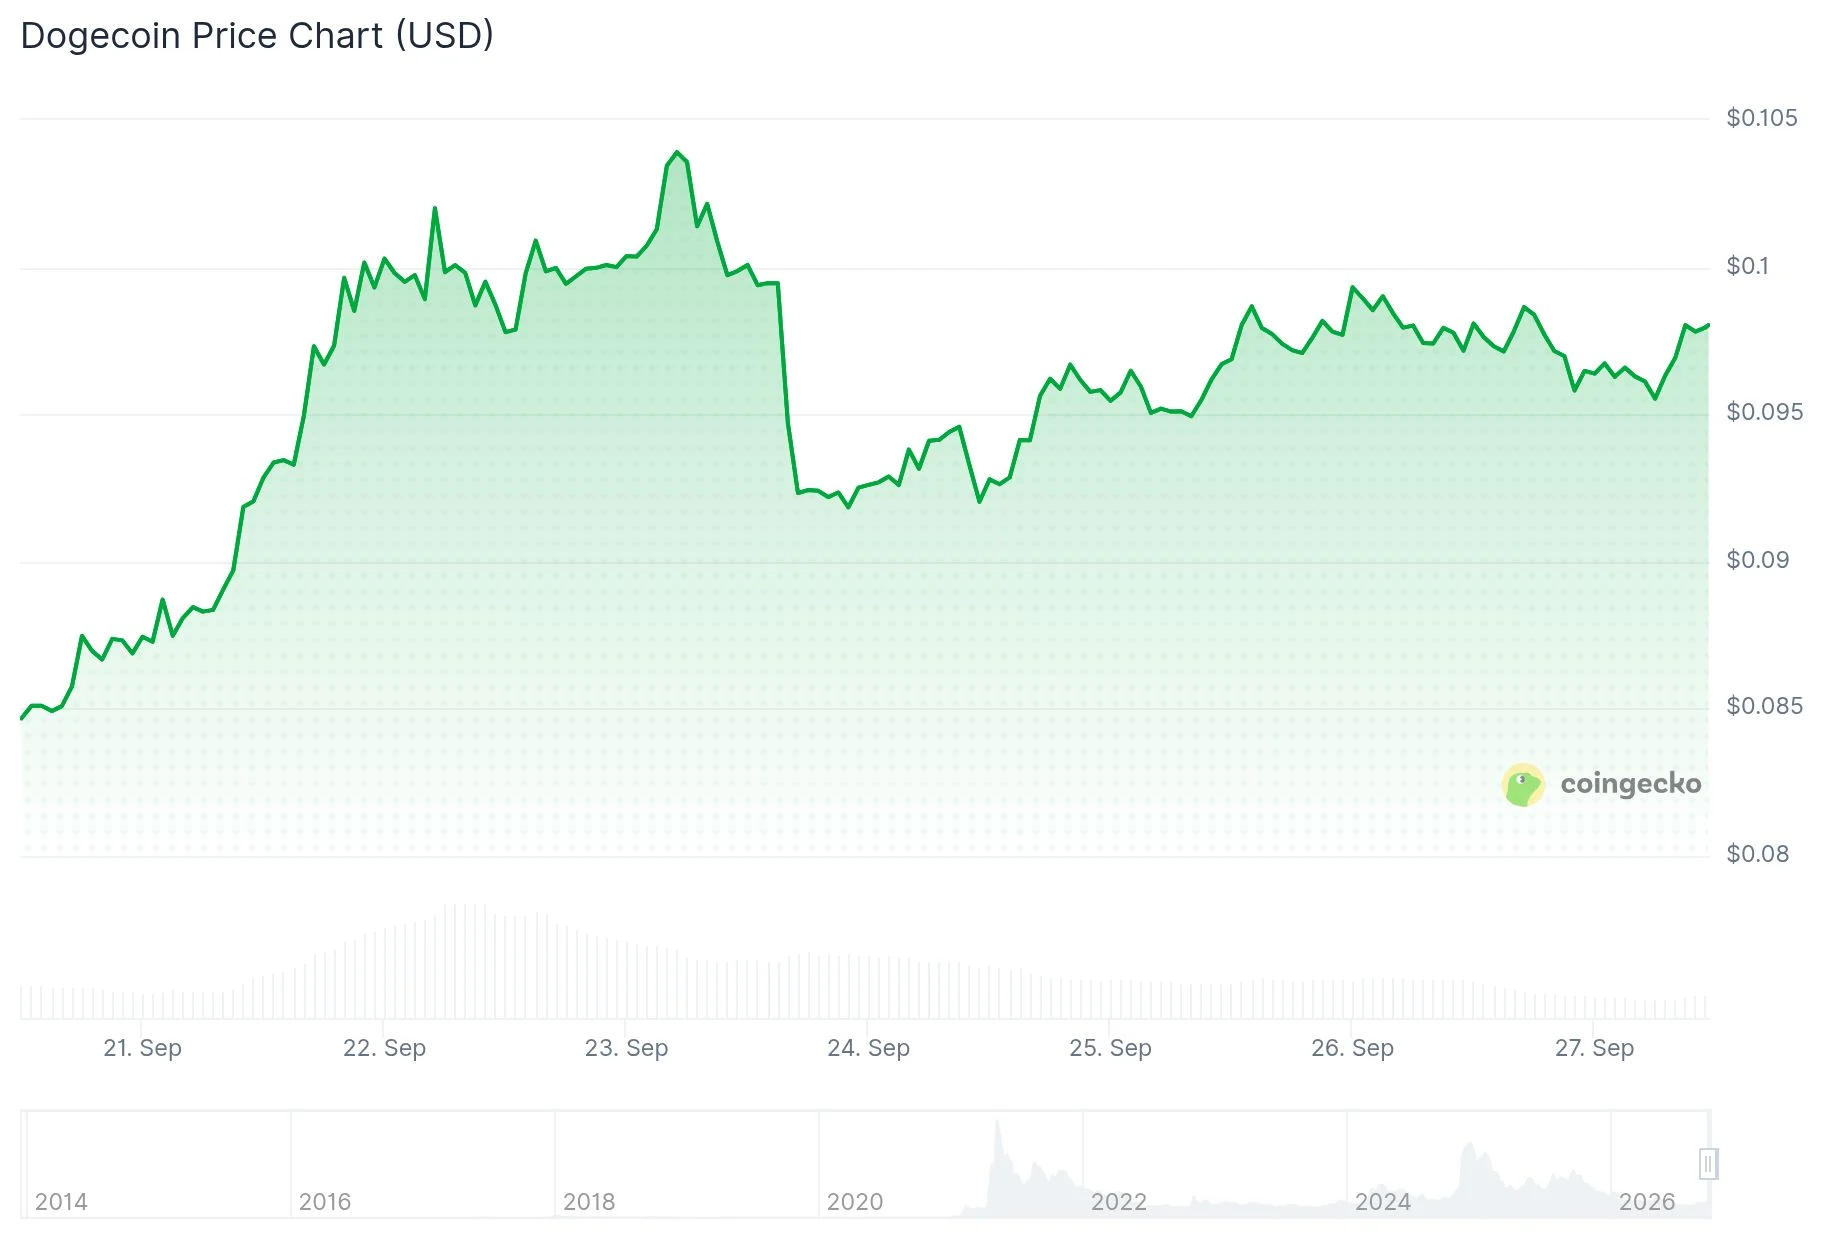
Dogecoin (DOGE) is holding its ground near $0.0985 after bouncing from September support levels, and fresh analysis points to continued accumulation by large holders even as the token presses against a key resistance zone on the daily chart.
The popular meme cryptocurrency — created in 2013 as a lighthearted joke currency and now one of the longest-running assets in the crypto market — opened today's session near $0.0971 before climbing to test $0.0985 under renewed upward pressure, posting gains of approximately 1.4% in the process. The digital asset continues to respect an ascending daily support line that has underpinned its market structure since August.
The technical landscape has improved markedly over the past several weeks. Following a bottom formation near $0.069 in August, Dogecoin has established a clear pattern of ascending lows paired with higher peaks. That price action has generated an upward-sloping support trend line that has proven resilient throughout September. DOGE currently maintains its position above this technical level, which now extends through the lower $0.08 region beneath the prevailing market price.
Each pullback in recent weeks has found support at progressively higher levels, and the pattern of higher lows and higher peaks has remained intact through September. Even as price presses into the heavily traded zone near $0.098 — the kind of area analysts watch closely because dense clusters of prior trading can resurface as resistance when price revisits it — the ascending trend line has repeatedly held beneath the market.
Critical Price Zones
Technical analysis reveals a significant horizontal support area positioned around $0.0792. This level has functioned as a crucial inflection point throughout the recent recovery phase.
To the upside, the primary resistance barrier stands at $0.1174. The level previously rejected price action during the May advance and remains the most formidable obstacle on the daily timeframe. While DOGE is still below that target, the current rebound has positioned it within striking distance once again.
Before attempting a test of $0.1174, bulls must first establish control above the $0.10 threshold. The cryptocurrency has made multiple approaches to this psychologically significant level throughout the current month without clearing it. Successfully doing so would enhance the near-term technical picture and establish a more direct route toward the resistance zone formed in May.
Should downward pressure emerge, the ascending trend line provides initial technical support. However, the $0.0792 level represents the more critical foundation for the current structure. A decisive close beneath $0.0792 would compromise the existing higher-low formation and redirect attention toward the August base area.
Technical Indicators and Whale Accumulation
The Relative Strength Index (RSI) for Dogecoin currently stands at 62.94. This reading exceeds the neutral midpoint of 50 while comfortably below the overbought boundary at 70, suggesting solid buying pressure that has not yet reached excessive levels.
The MACD indicator also displays positive characteristics, with the primary line positioned near 0.0039 compared to the signal line at approximately 0.0030. The histogram displays a value around 0.0010, confirming that near-term momentum has accelerated following the recent consolidation. Trading volume has expanded during multiple September sessions, with the most notable increases occurring during the advance away from the $0.0792 support zone.
$112 MILLION IN DOGE BOUGHT BY WHALES
Dogecoin has hit a major resistance zone around $0.098, where roughly 28 billion DOGE previously traded.
Yet whales continue to accumulate.
Over the past 96 hours, large entities have bought more than 1.14 billion $DOGE , worth roughly $112… pic.twitter.com/cfPrkShuk1
— Ali Charts (@alicharts) September 27, 2026
X post: Ali Charts (@alicharts)
Attention has also turned to the behavior of large holders. Market analyst Ali Charts highlighted the significant whale accumulation in an X post dated September 27, 2026. According to his analysis, Dogecoin encountered resistance around the $0.098 area, where approximately 28 billion DOGE previously changed hands. Despite that barrier, large holders acquired more than 1.14 billion DOGE tokens during the past 96 hours, representing roughly $112 million in value and suggesting positioning for an upward breakout.
Whale tracking has become a staple of cryptocurrency analysis for a straightforward reason: transfers on public blockchains are permanently recorded, giving observers a direct window into how large wallets behave. That visibility helps explain why accumulation readings of this kind tend to draw attention — they document what big holders are actually doing while the token sits below resistance, rather than relying on price action alone.
The current technical structure shows DOGE maintaining its position above trend support while momentum indicators continue to signal strength. The immediate focus is whether trading activity can generate the buying power needed to push through $0.10, the gateway to the $0.1174 resistance zone from earlier price action. Alongside the chart, observers tracking this setup have two additional reference points: whether the ascending trend line continues to absorb pullbacks in the sessions ahead, and whether the large-holder buying documented over the past 96 hours extends beyond that window.
This article originally appeared on Blockonomi.

