Dogecoin (DOGE) Holds $0.075 as Analyst Says a Bottom Is Forming
Key Takeaways
- •Dogecoin has lost both its August-to-September rally trendline and the $0.0792 support, which now caps the upside, while the $0.0680 August base stands as the next major downside level.
- •The daily RSI at 33.81 sits near the oversold threshold and the MACD histogram has nearly flattened, signaling easing downward pressure without confirming a bottom.
- •Analyst Trader Tardigrade argues Dogecoin is building another bottom amid fading sell pressure, with a breakout above resistance needed to confirm a reversal.
- •U.S. spot Dogecoin ETFs show limited institutional uptake, registering zero net flows on 166 of 199 trading days, and Bitwise closed its BWOW Dogecoin ETF in October after weak demand.
- •Network usage has slowed sharply, with weekly transactions and daily active addresses each down about 45% from a year earlier and new addresses down roughly 61%.
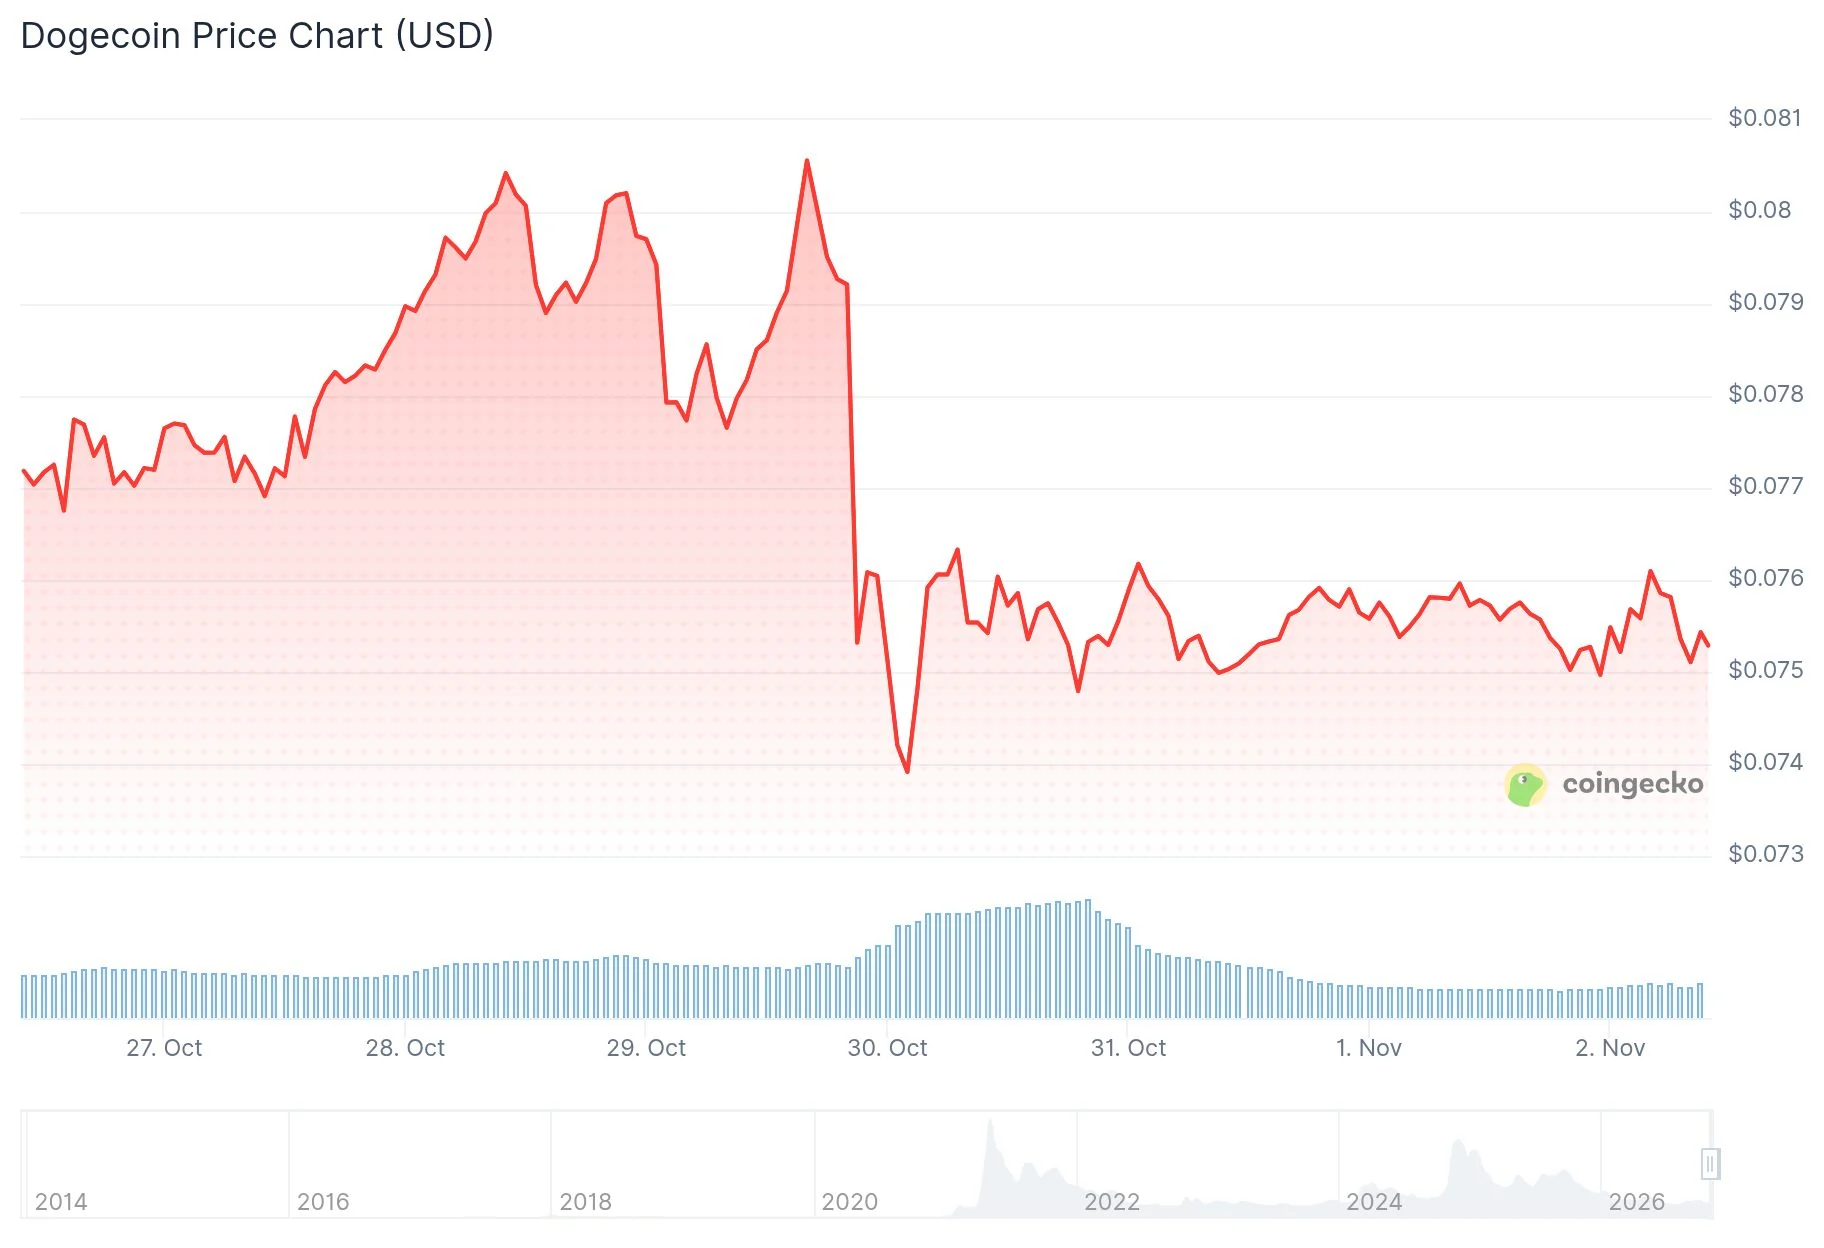
Dogecoin (DOGE) is trading near $0.075 on the Nov. 2 Binance daily chart, holding that level after an extended October selloff pushed it below the $0.0792 support zone. The meme coin — launched in 2013 and widely credited with spawning the meme-coin category — opened the day around $0.0758, touched roughly $0.0764, and dipped to $0.0749 before returning to the $0.075 area. It now sits well below its September peak near $0.10 and roughly 36% under the major resistance level at $0.1174.
With two months left in 2026, the token's near-term path hinges on whether buyers can defend the current range and rebuild momentum after weeks of losses. DOGE's chart is also frequently read as a sentiment gauge for the meme-coin segment as a whole.
$0.0792 Emerges as the Key Chart Level
The daily chart shows Dogecoin testing a series of clearly defined levels after weeks of decline. DOGE has broken below the rising trendline that supported its August-to-September rally and has also lost the $0.0792 horizontal support level. That mark should now act as resistance until buyers reclaim it. The next major support sits at $0.0680, which matches the August base and is likely to become the main downside target if selling continues.
Momentum indicators offer a mixed picture. The daily relative strength index (RSI), a momentum gauge scored on a 0-to-100 scale, stands at 33.81, close to the traditional oversold threshold of 30, suggesting that selling is stretched — though it does not confirm a bottom. The MACD, a trend-following indicator built from moving averages, remains below zero, but its histogram has nearly flattened, pointing to easing downside momentum. Taken together, the readings indicate downward pressure is losing force, even though a confirmed bottom has yet to emerge.
A move back above $0.0792 would put the $0.085-$0.09 range back in focus. From there, DOGE would need to clear $0.10 before the $0.1174 resistance comes into play.
Analyst Says Another Bottom Is Forming
Analyst Trader Tardigrade (@TATrader_Alan) posted a monthly chart on Nov. 2 arguing that Dogecoin has respected its long-term channels since day one, writing that the next massive bull run is a question of when, not if.
$Doge / monthly #Dogecoin has respected these channels since day one. The next massive bull run isn't a question of if, it's a question of when. pic.twitter.com/Fzmq9CuB8j — Trader Tardigrade 🧬 (@TATrader_Alan) November 2, 2026
In a Nov. 1 post based on the weekly chart, he said DOGE is forming another bottom, holding at a low position with declining sell pressure, and that he is watching for a breakout above resistance to confirm reversal momentum.
$Doge /weekly #Dogecoin is forming another bottom, holding at low position with declining sell pressure—watch for a breakout above the resistance to confirm reversal momentum. pic.twitter.com/PoJZLde7s6 — Trader Tardigrade 🧬 (@TATrader_Alan) November 1, 2026
ETF Demand and On-Chain Activity Stay Soft
While chart watchers point to a forming bottom, flow and usage data remain subdued. U.S. spot Dogecoin ETFs — funds that hold DOGE directly, with their daily net flows widely tracked as a gauge of institutional demand — recorded zero net inflows or outflows on Oct. 30, according to SosoValue data. Cumulative net inflows stand at $16.43 million, with net assets near $12.36 million and daily volume of about $556,000.
Institutional uptake has been limited since the products began trading. The three tracked U.S. funds had drawn just over $12 million through Sept. 10 and posted zero net flows on 166 of 199 trading days. Bitwise closed its BWOW Dogecoin ETF in October after weak demand, consistent with the broader industry practice of winding down funds that fail to attract sustained assets.
On-chain activity, which records how much a blockchain network is actually being used, has cooled as well. The network processed about 155,288 transactions in the week beginning Oct. 26, down roughly 45% from a year earlier. Daily active addresses averaged about 32,328, also a 45% decline, while new addresses totaled around 60,940 for the week, a drop of about 61%. The figures point to a broad slowdown in network usage during the period.
Large transfers remain active, however. About 9.64 billion DOGE moved in the week of Oct. 25, with 79% of that volume consisting of payments of at least one million DOGE.
Dogecoin Labs Brings MyDoge, DogeOS and Such App Under One Roof
Dogecoin Labs was created on Oct. 21 with support from the Dogecoin Foundation, consolidating MyDoge, DogeOS and Such App into a single company focused on payments, consumer apps, DeFi and gaming.
MyDoge, a Dogecoin wallet app, reports more than 500,000 users. DogeOS is running a public testnet with no confirmed mainnet date, and Such App is testing merchant payments.
Key Levels Ahead
From $0.075, DOGE needs a gain of about 33% to reach $0.10 and roughly 57% to retest $0.1174. The pivotal levels remain $0.0792 to reclaim on the upside and $0.0680 to defend on the downside. Away from the chart, upcoming daily ETF flow reports and weekly on-chain updates will show whether demand and network usage stabilize from current levels.
This article originally appeared on CoinCentral.

