"Core GDP" Remains Strong as AI-Related Investment and Imports Shape Growth Dynamics
Key Takeaways
- •Core GDP growth, which excludes government spending, inventories, and net exports, is expanding faster than headline GDP but has not yet returned to its 2023/24 trend level.
- •The direct GDP contribution from AI-related investment is largely offset by corresponding imports of semiconductors and computing hardware, making the net accounting effect minimal outside of Q2.
- •Real household net worth rose 5% in 2025, and researchers estimate that wealth gains accounted for approximately half of the year's 2% consumption growth.
- •If real household wealth remains flat in 2026, consumption growth could fall by about one percentage point, reducing GDP growth by roughly two-thirds of a percentage point.
- •A decline in AI-related equities could weaken the wealth channel supporting consumption, creating a negative feedback loop between technology sector performance and broader economic activity.
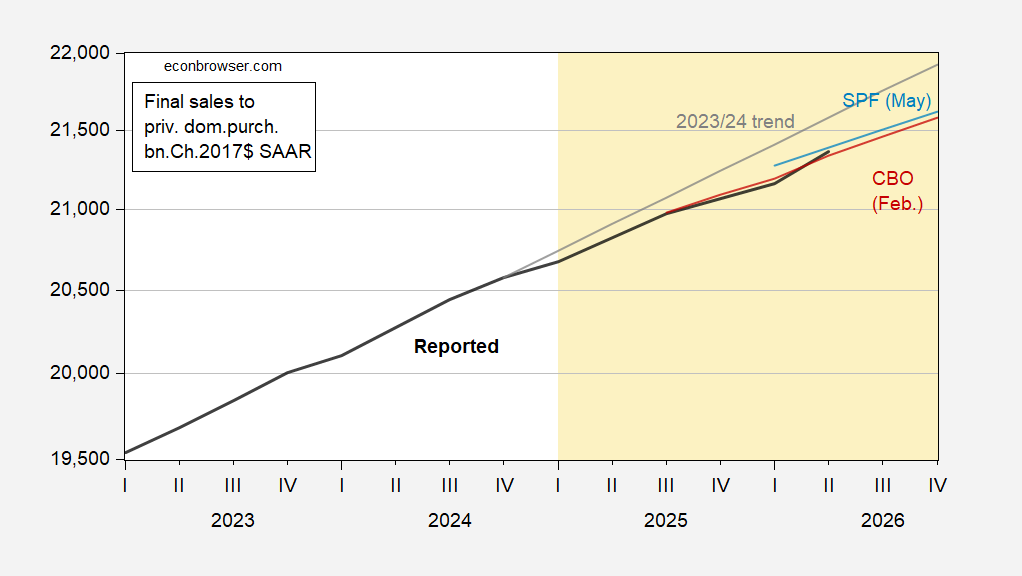
Building on Jim's assessment of slow but steady headline GDP growth, core GDP growth—measured by final sales to private domestic purchasers—continues to show strength. This metric strips out government spending, inventories, and net exports, making it a closer read on underlying private demand. However, GDP growth is increasingly reliant on AI-related investment spending.
Final sales to private domestic purchasers are depicted in bold black, alongside the 2023/24 trend (gray), the CBO February projection (red), and the May SPF median forecast (light blue), all expressed in billions of chained 2017 dollars at seasonally adjusted annual rates. Source: BEA 2026Q2 advance release, February CBO Budget and Economic Outlook, Philadelphia Fed, and author's calculations.
While core GDP is growing faster than headline GDP, the actual level remains below the 2023/24 trend.
Regarding the importance of direct AI-related expenditures, with the exception of Q2, the effect appears to be a wash in an accounting sense, given the balance between information equipment and software investment on one side and computer and semiconductor imports on the other. In other words, much of the AI capital spending that boosts domestic investment is offset in the GDP accounts by the imported semiconductors and computing hardware that supply it.
Figure 2 illustrates GDP growth SAAR (bold black), broken into contributions from information equipment and software investment (green bar), computer and semiconductor imports (red bar), consumption (yellow bar), and the rest of GDP (blue bar). Source: BEA and author's calculations.
This is an accounting decomposition. The AI boom has also manifested in added household wealth. Bigot and Espic (2026) argue that approximately half of the 2% consumption growth in 2025 was attributable to the increase in wealth, based on differentiating wealth effects between high-income and low-income households. Real household net worth rose 5% in 2025. Assuming flat real household wealth in 2026—which could result from roughly a 7% S&P 500 decline from June to December—that would subtract about one percentage point from consumption growth, translating to approximately two-thirds of a percentage point of GDP growth.
As for the current state of these measures, real household net worth (blue) and the S&P 500 (red) are shown in logs with 2025Q1 set equal to zero, using end-of-period values and deflated by the PCE deflator. July PCE figures reflect the Cleveland Fed nowcast. Source: Federal Reserve Board Flow of Funds, BEA, S&P/Dow Jones via FRED, Cleveland Fed, and author's calculations.
So long as equity markets remain buoyant—dependent in part on AI prospects—aggregate demand will continue to be supported. This linkage underscores a key vulnerability: if AI-related equities falter, the wealth channel that has reinforced consumption growth could weaken in tandem, creating a feedback loop between technology sector performance and broader macroeconomic momentum.
Turning to a segment of the AI universe, total returns (unweighted) for the Magnificent 7 versus the S&P 500 provide additional context. Source: Bloomberg, accessed August 1, 2026.

