Crypto Market Drops as US Inflation Hits 3.7%, Bitcoin Falls Below $82,000
Key Takeaways
- •Bitcoin slipped to roughly $81,676, falling below the $82,750 support level and its 50-day moving average, with a bearish MACD divergence and declining RSI pointing to additional downside toward $80,400.
- •The September consumer inflation report showed headline inflation at 3.7% year over year and core inflation rising from 2.4% to 2.6%, both exceeding economists' expectations.
- •U.S. Treasury yields climbed after the data, with the ten-year yield reaching 5.24%, and a PIMCO analyst warned the ten-year could hit 6% for the first time since 2000.
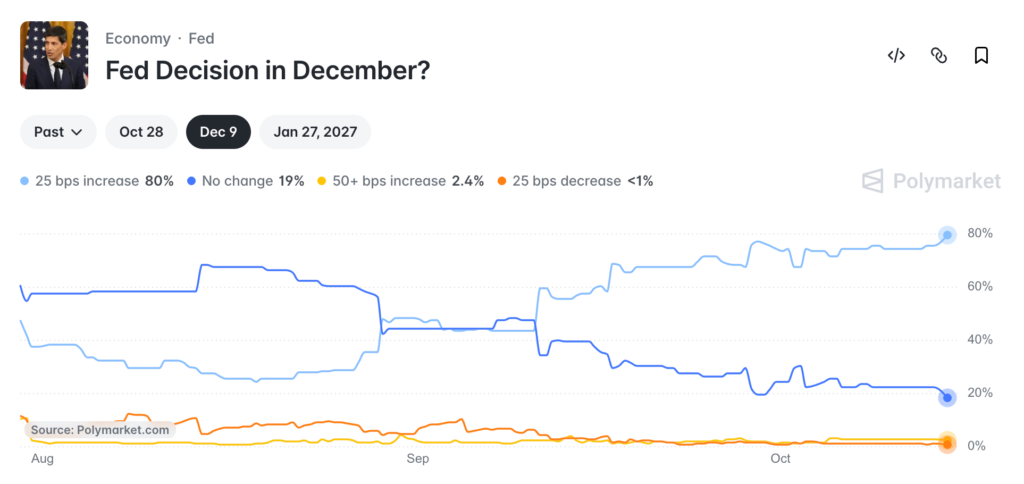
- •Prediction markets on Polymarket and Kalshi raised the probability of a Federal Reserve rate hike at the Oct. 27-28 meeting to 37%.
- •Spot Bitcoin ETFs lost $278 million this month and spot Ethereum ETFs shed over $695 million, while XRP funds added $12 million.
Bitcoin and most major altcoins traded lower on Wednesday, Oct. 14, after newly released U.S. inflation data came in above economists' expectations. Bitcoin slipped below $82,000 as rising Treasury yields intensified concerns about further monetary tightening from the Federal Reserve. The selloff came in response to the September consumer inflation report, which showed price pressures strengthening on both a headline and a core basis.
During the sell-off, the total cryptocurrency market capitalization approached $2.75 trillion. Ethereum, XRP, and Solana came under renewed selling pressure as investors reduced exposure to risk assets. Treasury yields climbed following the inflation release, raising expectations for another Federal Reserve interest rate hike and adding uncertainty ahead of the central bank's Oct. 27–28 policy meeting.
Inflation Runs Hotter Than Expected
The September consumer inflation report from the Bureau of Labor Statistics (BLS) showed that headline consumer inflation rose 0.6% on a month-over-month basis. That translated into an annual increase of 3.7%, above the expected 3.6%.
Core inflation, which excludes volatile food and energy prices, climbed from 2.4% in August to 2.6% in September, exceeding the expected 2.5%. The numbers indicate that U.S. inflation is moving in the wrong direction, which could push the Federal Reserve to raise interest rates as soon as this month. Core readings tend to carry extra weight in Fed decision-making, since food and energy prices can swing sharply month to month and obscure the underlying trend.
A key complication is that the current inflation is being driven by the ongoing crisis in the Middle East, which continues to escalate. A rate hike would not stop the war, meaning inflation could prove stickier for longer.
Bond Yields Jump After Inflation Data
Those fears explain why U.S. bond yields continued to climb in the wake of the release. The ten-year yield jumped to 5.24%, while the 30-year and five-year yields rose to 5.5% and 5.05%, respectively. Analysts worry these metrics will likely keep rising in the near term. In a recent statement, a top analyst at PIMCO warned that the ten-year yield will hit 6% for the first time since 2000. Yields at these levels raise the returns available on government bonds, sharpening the competition for capital that might otherwise flow into riskier assets.
Odds of a Fed Rate Hike Are Rising
Odds that the Federal Reserve will hike interest rates this year have continued rising on the prediction markets Polymarket and Kalshi, where traders wager on policy outcomes. Data show the probability of a hike this month rose to 37%, up from 87% in December. The Fed's Oct. 27–28 meeting is the next scheduled opportunity to act, giving those odds a concrete deadline as the decision approaches.
The crypto market tends to underperform when the Fed hikes rates and bond yields rise. Bitcoin, like gold, is a non-yielding asset that tends to lag as investors move into bonds. That dynamic explains why gold has continued to underperform the market this month, and why American investors are starting to pare back their crypto ETF holdings.
Spot Bitcoin ETFs have lost $278 million this month, a sharp reversal from the previous three months, when such funds added over $6 billion in assets. The trend extends to other tokens: spot Ethereum ETFs have shed over $695 million this month, while XRP funds added $12 million. Because fund flow data is published daily, these figures offer a running gauge of how quickly investors are adjusting their crypto exposure.
Bitcoin Technicals Point to a Retreat
The daily chart shows Bitcoin peaked at $87,348 in September before pulling back to its current level of $81,676. The token has now slumped below the crucial support level of $82,750 — its highest point in May this year — and dropping below that level confirmed the bearish outlook.
Bitcoin has also moved below its 50-day moving average, while the two lines of the MACD have formed a bearish divergence, a pattern that occurs when the indicator moves downward while the asset rises. The Relative Strength Index (RSI) has continued moving downward.
The path of least resistance is therefore to the downside. The initial target to watch is $80,400, a level that sits near the 23.6% Fibonacci Retracement level. If Bitcoin falls to that target, the broader crypto market would likely continue falling.
This article is for informational purposes only and does not constitute financial or investment advice.
This article originally appeared onThe Market Periodical](https://themarketperiodical.com/2026/10/15/crypto-market-drops/).

