Bitcoin consolidates near $77,000 as traders lock in $1.72 billion in profits
Key Takeaways
- •Bitcoin holders realized about $1.72 billion in profits on Friday, the highest daily realized profit total since late November 2024.
- •US spot Bitcoin ETFs recorded roughly $1.92 billion in net inflows last week, the strongest weekly inflow this year and since mid-October 2025.
- •Bitcoin tested the 61.8% Fibonacci retracement level at $78,490, which is an immediate technical resistance area.
- •CryptoQuant's apparent demand metric has moved back into positive territory after staying negative since late February.
- •Bitcoin's daily RSI is around 79, indicating overbought conditions and a greater risk of near-term consolidation or profit-taking.
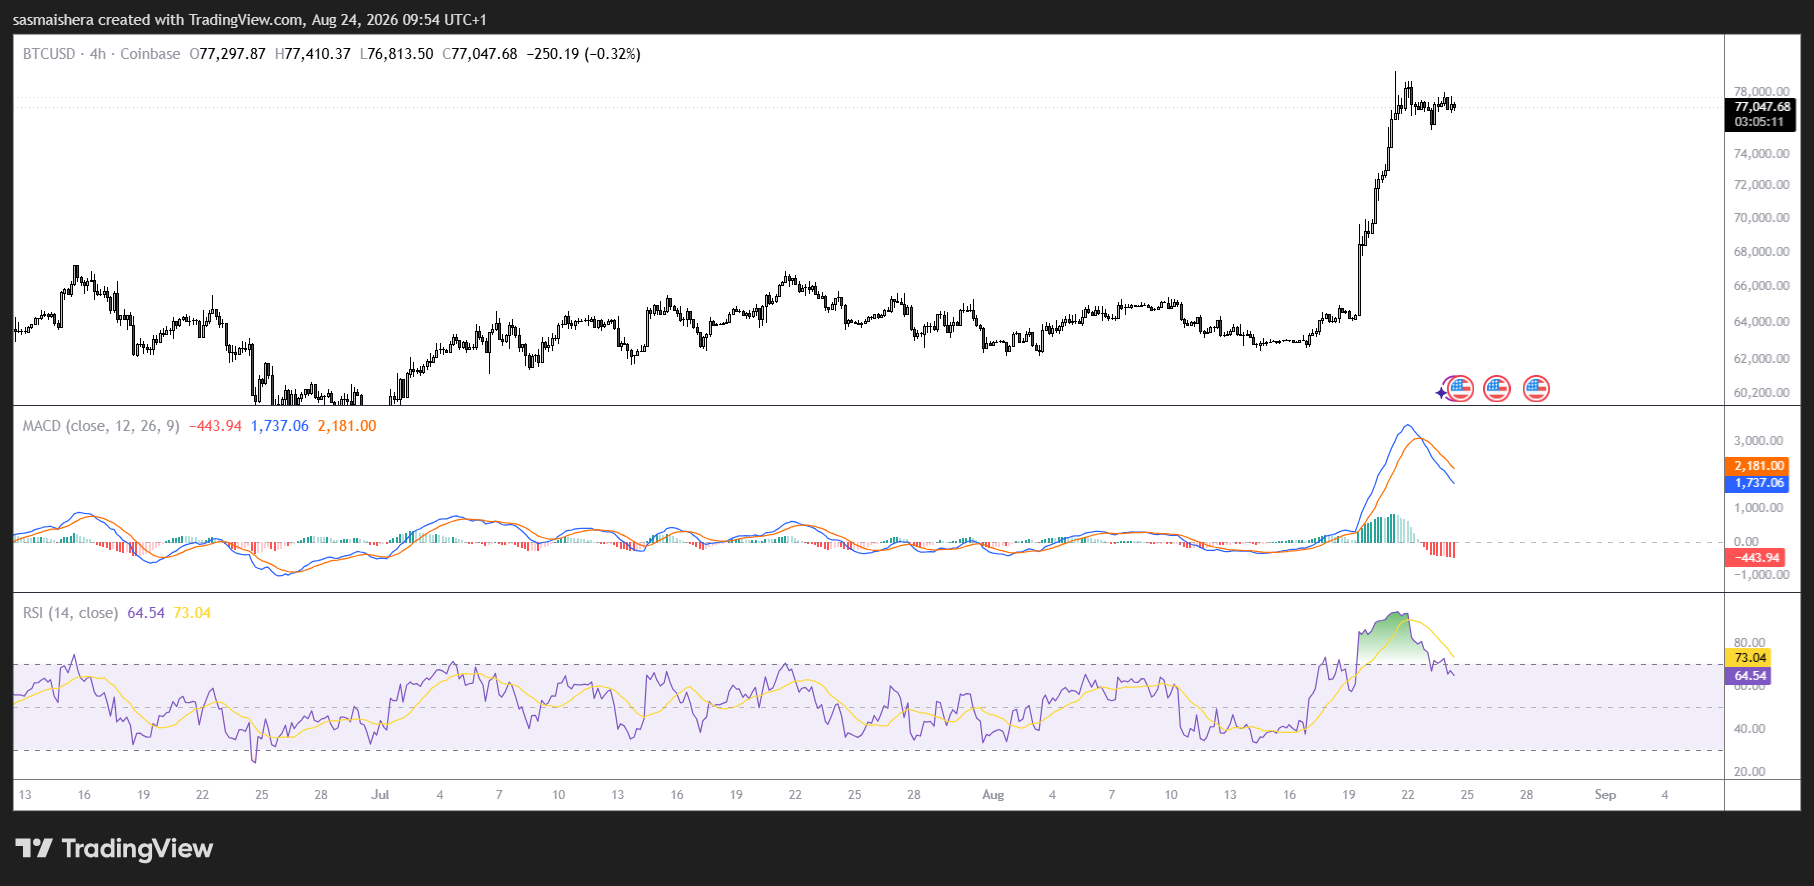
Bitcoin is trading around $77,000 on Monday after rising more than 23% last week, its strongest weekly gain since mid-March 2023.
The rally followed the US Treasury's announcement that it would expand its debt buyback operations, which improved sentiment across cryptocurrency markets. Under the regular buyback program launched in 2024, the Treasury repurchases outstanding government securities to support liquidity in the Treasury market, and shifts in that broader liquidity backdrop are closely tracked by crypto traders. The advance was also supported by strong institutional demand, with US spot Bitcoin exchange-traded funds recording their largest weekly inflows since October 2025.
At the same time, on-chain data suggests that some investors are taking profits as BTC approaches the psychologically important $80,000 level. That selling could lead to a temporary consolidation phase or a short-term pullback before Bitcoin attempts another move higher.
Bitcoin investors realize $1.72 billion in daily profits
CryptoQuant data shows Bitcoin holders realized approximately $1.72 billion in profits on Friday. That was the highest daily realized profit total since late November 2024. In on-chain analysis, realized profit is recorded when coins previously acquired at lower prices move on-chain, so the $1.72 billion figure reflects gains that sellers have actually locked in rather than unrealized paper gains.
Last week's sharp price increase pushed many investors back into profitable territory, prompting some holders to sell and lock in gains. Historically, large jumps in realized profits can come before a period of consolidation or a temporary correction as more supply enters the market.
That does not necessarily mean Bitcoin's broader recovery is over, but it does suggest the market may face stronger selling pressure near key resistance levels.
Even with the increase in profit-taking, Bitcoin's underlying spot demand has improved. CryptoQuant's apparent demand metric has moved into positive territory after remaining negative since late February.
That shift suggests net buying interest has strengthened and could help support prices even as some investors reduce exposure. A continued improvement in spot demand would help offset selling pressure and support the case for further gains. Traders will be watching whether buyers can maintain that momentum while BTC consolidates below $80,000.
Institutional investors played a major role in last week's advance. US spot Bitcoin ETFs — the funds first approved by US regulators in January 2024, which hold BTC directly and have since become a primary channel for institutional exposure — recorded about $1.92 billion in net inflows, according to SoSoValue data. That was the highest weekly inflow this year and the strongest since mid-October 2025.
Continued inflows could give Bitcoin additional support as it tries to move through nearby resistance. By contrast, a slowdown in institutional demand could make it harder for BTC to hold its recent gains, especially while short-term momentum appears stretched.
BTC faces immediate resistance at $78,490
Bitcoin recently tested the 61.8% Fibonacci retracement level at $78,490. That level is based on the move from the August 2024 low near $49,000 to the October 2025 record high of $126,199. The 61.8% ratio is one of the most widely followed retracement levels in technical analysis, used by traders to map how far a price move may retrace within a broader trend.
A weekly close above $78,490 would strengthen the bullish technical picture and could open the way toward the 50-week Simple Moving Average at $81,059. Before reaching that level, Bitcoin would also need to clear the psychological resistance at $80,000.
If buyers push BTC above both barriers, the next major upside target would be the 50% Fibonacci retracement level at $87,599. The 100-week SMA near $88,990 is another major resistance level in the same area.
Bitcoin remains above its 200-week SMA at $64,571 after breaking out of a prolonged consolidation phase. The weekly Relative Strength Index is near 55, comfortably above the neutral 50 mark, indicating that momentum has improved without reaching an extreme on the weekly timeframe.
The weekly Moving Average Convergence Divergence indicator also remains bullish after a positive crossover in mid-July. Rising green histogram bars suggest upward momentum is still building. Together, these indicators support the possibility of additional gains if Bitcoin can clear resistance between $78,490 and $81,059.
The daily chart shows a more cautious picture, despite Bitcoin's strong overall structure. BTC is trading well above its 50-day, 100-day and 200-day Exponential Moving Averages, which are located at $66,786, $67,415 and $71,781, respectively.
However, the daily RSI has climbed to around 79, placing Bitcoin firmly in overbought territory — above the 70 threshold that technicians conventionally use to define that condition. That does not automatically signal an imminent reversal, but it often indicates that a market may need to consolidate or retrace after a sharp advance.
The daily MACD remains positive, confirming that bullish momentum is still in place, although the strength of the recent move leaves BTC vulnerable to profit-taking.
If Bitcoin pulls back, the 200-day EMA near $71,781 would be the first major technical support level. The psychological $70,000 level is another important area that could attract buyers if selling pressure increases. A deeper decline would expose the 100-day EMA at $67,415 and the 50-day EMA at $66,786. Nearby horizontal support at $66,500 reinforces that broader demand zone. If those levels fail, Bitcoin could move toward the next major support area around $62,300.
For now, BTC's immediate outlook depends on whether buyers can absorb profit-taking and push the price above $78,490 and $80,000. A successful breakout would keep $81,059 and the $87,599 to $88,990 region in focus. In the meantime, the data that shaped this rally — daily spot ETF flow figures alongside CryptoQuant's realized-profit and apparent-demand metrics — will offer the clearest reads on whether supply from profit-taking is being absorbed.

