Bitcoin Price Retests $61,500 Zone It Lost in June
Key Takeaways
- •The November selloff broke four Fibonacci retracement levels in sequence — 0.382 near $76,070, 0.5 near $72,580, and 0.618 near $69,090 — with only the 0.786 level near $64,115 producing a pause.
- •The daily RSI reads 19.93, well below its own average of 28.96, though in early June similarly oversold conditions led only to a brief rebound before price broke lower.
- •Bitcoin trades roughly 15% below its 200-day SMA at $72,690, while the 50-day SMA at $78,230 is rolling over sharply and the 100-day at $77,760 is flattening.
- •A decisive daily close below $61,400 would remove the last horizontal buffer and put the late-June low near $57,780 in focus as the next downside reference.
- •On the monthly timeframe, the $61,500 zone overlaps the 2021 double top and the floor of the 2024 range, which is why the November close relative to that level is being watched closely.
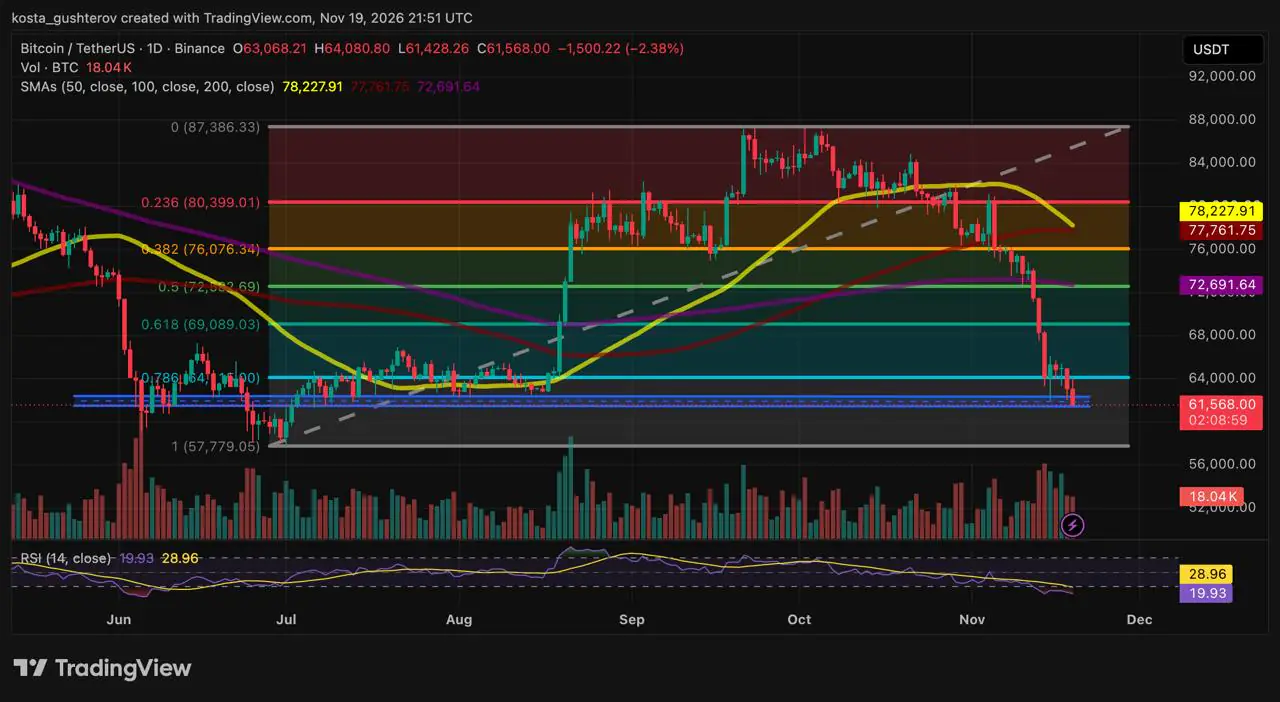
Bitcoin has dropped from near $87,380 to $61,550, cutting through its daily moving averages and a series of Fibonacci supports before arriving at the zone where it repeatedly turned in June and July. Whether that area holds again is now the central question on the BTCUSDT daily chart, after it gave way once in late June and then held through the summer.
According to Coindoo's technical analysis, price is sitting on June-July demand near $61,500, the daily RSI reads 19.93 — deep in oversold territory — and Bitcoin trades 15% below its 200-day simple moving average. Thursday's high stalled just below $64,115. The 200-day SMA is one of the most widely followed long-term trend benchmarks in technical analysis, and price sitting 15% beneath it underlines how far the decline has stretched from that long-term average.
Four Fibonacci Levels Gone in November
The retracement grid runs from the late-June low near $57,780 to the September peak near $87,380. Retracement levels drawn from a move of this size are standard reference points chartists use to gauge how deep a correction has run. Price slipped under the rising dashed trendline drawn from that low in late October, and the November selloff then ran through four retracement levels in turn.
The 0.382 level near $76,070 went first. The 0.5 retracement near $72,580 followed on heavy red candles, and losing it cost two supports at once, since the 200-day simple moving average sits close by at $72,690. The 0.618 level near $69,090 barely slowed the decline. Only the 0.786 level near $64,115 produced a pause, a brief bounce before sellers returned.
The 50-day SMA at $78,230 is rolling over sharply, and the 100-day at $77,760 is flattening just beneath it. With the 200-day at $72,690, price now trades about 15% below the slowest of the three averages.
Where Thursday's Session Stalled
Thursday's session opened at $63,060, already below the 0.786 level near $64,115. Price rose to $64,080, about $35 short of that line, then turned lower to $61,430. A close near current prices would mean the level that supported the mid-November bounce has now turned price away from below.
The drop brought Bitcoin to the lower edge of the blue horizontal band between roughly $61,500 and $62,300. The band caught the early-June selloff, gave way in late June — when price fell to near $57,780 — and was back above it within days. Through July and into mid-August, it absorbed several pullbacks before the breakout toward $76,000. Thursday's low dipped under $61,500 but stayed above $61,400.
What Oversold Meant Last Time
The daily RSI (14) reads 19.93, well below its own 28.96 average, a measure of how far and how fast price has fallen. The RSI is a momentum indicator, and readings below 30 are conventionally treated as oversold, which puts 19.93 well inside that band. A reading this low does not, by itself, mark a bottom.
Early June offers a test case on this chart. RSI dropped deep into oversold territory then as well, and price rebounded briefly before breaking below the blue band toward the late-June low. An oversold reading can precede a relief rally or merely interrupt a decline. In June, it was the second.
What Would Change the Daily Picture
If the floor holds: daily closes inside or above the $61,500 zone, with RSI turning up from 19.93, would leave room for a short-covering bounce toward the 0.786 level near $64,115. A stronger relief move would meet the 0.618 retracement near $69,090.
If $61,400 gives way: a decisive daily close below $61,400 would remove the last horizontal buffer above the range floor, leaving the 1.0 Fibonacci level and the late-June low near $57,780 as the next reference.
As a trend check, a bounce remains counter-trend until price reclaims the level near $64,115 and then the one near $69,090. Both still sit below the 200-day SMA at $72,690 and the 0.5 level near $72,580.
Larger-Timeframe Context
The $61,500 area carries more weight on a bigger chart. Coindoo's monthly Bitcoin chart analysis traces it to the 2021 double top and the floor of the 2024 range, with the 0.5 Fibonacci retracement near $63,160 just above it. That overlap between recent daily demand and structure from prior years is why one zone is being watched from both the daily and monthly perspectives. On that timeframe, the November close relative to $61,500 is also the test that matters.
This article is for informational purposes only and does not constitute financial or investment advice. The levels and scenarios described are based on technical analysis of the daily chart and are not predictions of future price movement. Cryptocurrency markets are highly volatile; always do your own research before making any investment decisions.

