Bitcoin Finds Buyers at Its $80,000 Floor as the Crypto Rebound Stays Narrow
Key Takeaways
- •Bitcoin recovered toward $82,900 on October 9 after finding buyers in the $80,000–$80,500 zone, having earlier fallen below $83,000 in the previous session's sell-off.
- •The $80,000–$80,500 support area combines the 0.236 Fibonacci retracement near $80,300, the rising 50-day simple moving average, and the lower boundary of Bitcoin's daily upward channel.
- •CoinMarketCap showed Bitcoin up 0.36% over 24 hours at $82,909 around 14:48 UTC, while Ethereum, BNB, XRP, and Solana remained down more than 1%, with Dogecoin and Cardano posting larger declines.
- •President Donald Trump said the United States would avoid attacking Iran before the November 3 midterm elections, easing fears that had driven higher oil prices and Treasury yields earlier in the week.
- •A daily close above $80,000–$80,500 would strengthen the case that buyers are defending the zone, while a sustained close below it would place the September recovery under greater pressure.
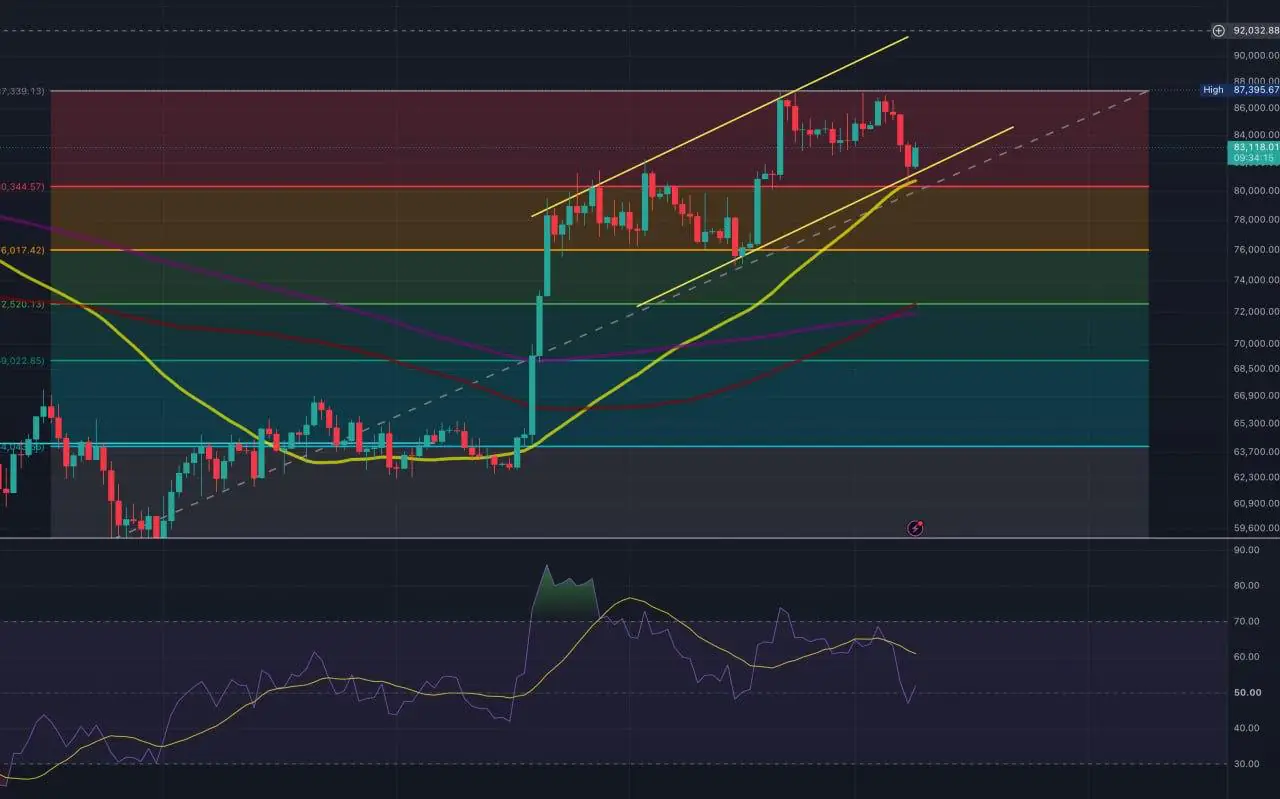
Bitcoin found buyers near $80,000–$80,500 on October 9, where three daily-chart signals converge, and recovered toward $82,900 after the previous session's sell-off. Ethereum, BNB, XRP, Solana, Dogecoin, and Cardano remained lower over 24 hours, keeping the market's rebound narrow. A statement from President Donald Trump on Iran also eased one immediate source of risk pressure.
Three Chart Signals Converge Near $80,000
The rebound followed a decline that had pushed the price below $83,000 and into an area that had already stood out on the daily chart, as covered in Coindoo's earlier report on Bitcoin's drop as oil and Treasury yields climbed. That placed the pullback directly on top of the levels traders were already watching.
The $80,000–$80,500 area contains the 0.236 Fibonacci retracement near $80,300, the rising 50-day simple moving average, and the lower boundary of Bitcoin's upward channel on the daily BITSTAMP:BTCUSD chart on TradingView. Together, these references place the latest pullback in the same range where the September recovery faces a more meaningful test. Fibonacci retracements are calculated by applying standard ratios to a prior price swing, and the 50-day average tracks the mean of the past 50 daily closes — two widely followed reference points, which is why their overlap draws attention as a single zone.
Yesterday's lower wick reached the Fibonacci line before Bitcoin recovered. That reaction gives the wider zone more weight, because the pullback met a calculated retracement, a moving average, and a rising channel boundary in close succession.
Several wicks have extended outside the channel during volatile sessions, yet its lower edge continues to rise beneath price. Bitcoin has not produced a sustained series of daily closes below that line, leaving the broader recovery structure intact while the market trades above it.
A higher daily close that keeps the candle body above the demand zone would give the rebound more substance. With momentum having cooled back toward neutral territory, the response around $80,000 offers a clearer signal than the RSI alone.
Bitcoin Recovers Ahead of Large Altcoins
At about 14:48 UTC on October 9, CoinMarketCap showed Bitcoin up 0.36% over 24 hours at $82,909. The rest of the large-cap board remained weaker, with most major assets still carrying losses from the preceding decline.
Ethereum, BNB, XRP, and Solana were still down by more than 1%, while Dogecoin and Cardano posted the larger declines. Bitcoin has slowed the wider retreat, although the market has yet to show the more unified demand that would lift the leading altcoins with it. Whether gains spread beyond Bitcoin is something market participants commonly track, since the breadth of participation is a widely used gauge of how much risk appetite has returned.
The Iran Pause Eases an Immediate Pressure Point
The market also received a calmer geopolitical signal after President Donald Trump said the United States would avoid attacking Iran before the November 3 midterm elections, according to the Guardian's report on the statement.
Fears of escalation had fed into higher oil prices and Treasury yields, creating a more difficult backdrop for crypto earlier in the week. Higher yields raise the return available on cash-like instruments and lift financing costs across risk markets, while costlier oil feeds inflation expectations — a mix that weighs on the relative appeal of non-yielding assets such as Bitcoin. The stated pause narrows the near-term scenario traders had been pricing, while the wider conflict and its potential effect on energy markets remain unresolved.
The calmer tone arrived as Bitcoin tested its daily-chart support cluster. Oil, bond yields, derivatives positioning, and spot demand will continue to shape the next move, while the slower response from altcoins shows that traders are still taking risk selectively.
The Close Will Show Whether Buyers Can Defend the Zone
Bitcoin has already tested the Fibonacci component of this confluence area. A daily close above $80,000–$80,500 would strengthen the case that buyers are defending the wider zone, while a sustained close below it would place the September recovery under greater pressure.
This article is for informational purposes only and does not constitute investment or trading advice. Cryptocurrency prices and technical levels can change quickly.

