Bitcoin Price Prediction: BTC Risks $73.5K as Demand Weakens
Key Takeaways
- •Bitcoin traded around $77,900 on September 3 and stayed above its 20-, 50- and 100-period exponential moving averages on the four-hour chart.
- •The price remained below the $79,000 to $80,000 resistance band, which has repeatedly rejected advances since late August.
- •U.S. spot Bitcoin ETFs recorded $236.5 million in net outflows on September 1 and $101.1 million in net inflows on September 2, showing uneven institutional demand.
- •CryptoQuant data showed 663,215 BTC tied to profit-taking behavior and 324,767 BTC in the loss-seller cohort through September 1.
- •A sustained break below the $75,516 moving average would weaken the short-term structure and expose the $73,500 level, while a move above $80,000 would be the clearest bullish confirmation.
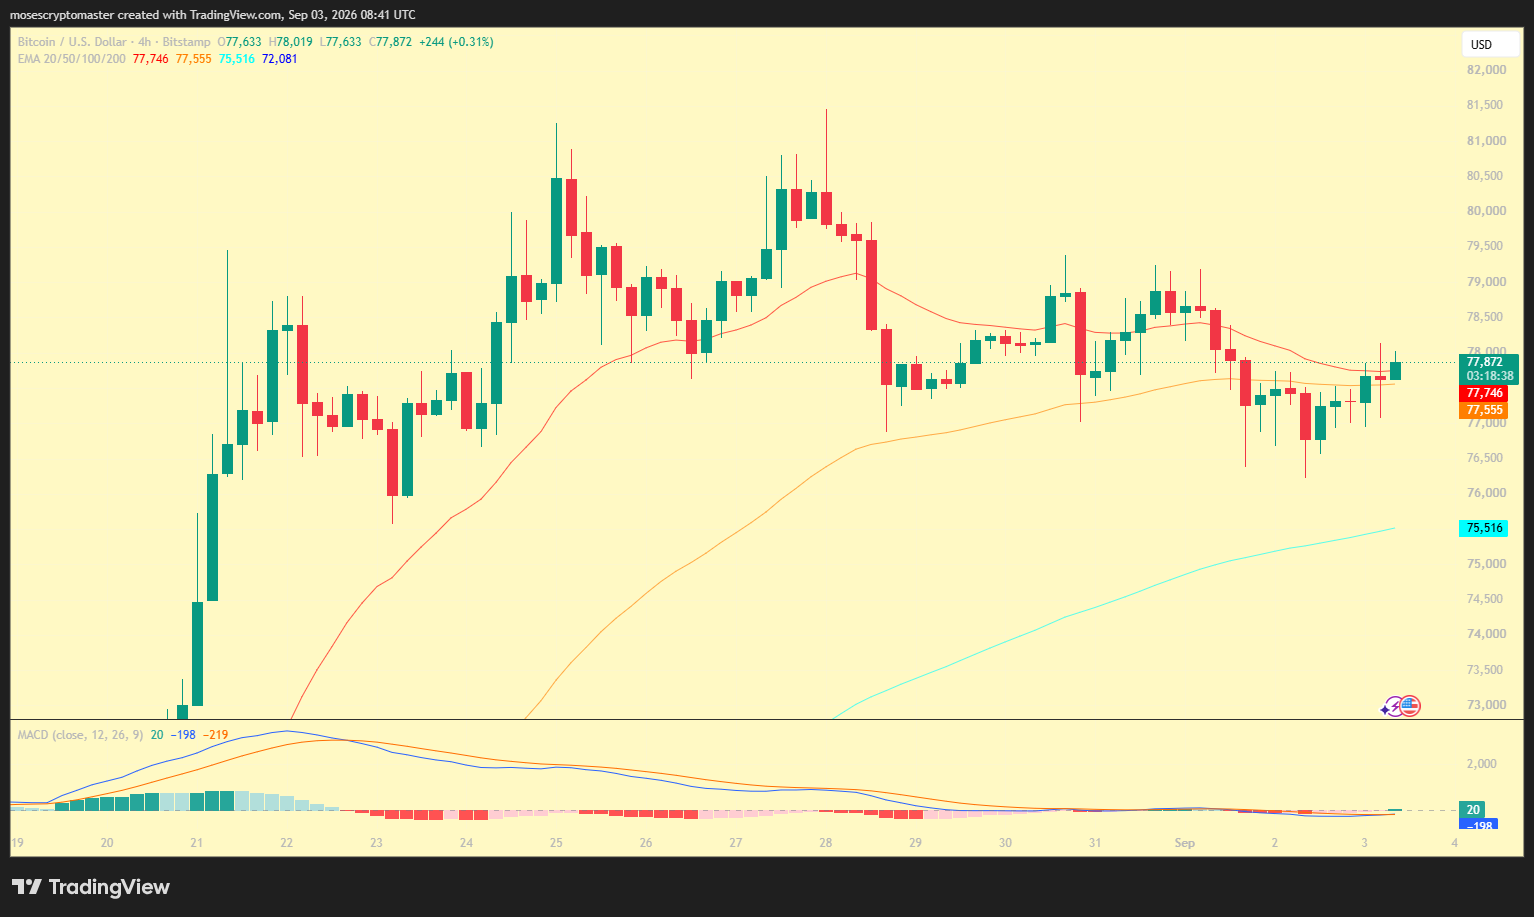
Bitcoin's rebound stalled near $78,000 on September 3 as spot demand weakened following August's rally. The Bitcoin price prediction now hinges on buyers defending nearby moving-average support while reclaiming resistance above $78,000. TradingView data showed BTC trading near $77,900 in the latest four-hour session.
The slowdown was notable because Bitcoin entered September after gaining roughly 25% during August — a monthly advance Coinbase described as Bitcoin's best performance in a year. September has also historically been a weak month for Bitcoin, with the token logging losses in most Septembers since 2017, adding a seasonal headwind to the demand question. However, weaker spot absorption and uneven exchange-truded fund flows left the rally exposed to renewed selling.
Weak Demand Near $78K
TradingView's four-hour chart showed Bitcoin trading around $77,892 on September 3. Price sat above the 20-period exponential moving average near $77,748, as well as the 50-period average around $77,556 and the 100-period average near $75,516.
Those levels kept the short-term structure constructive despite the pullback from August highs. However, price remained below the recent resistance band between roughly $79,000 and $80,000, a zone that has repeatedly rejected price since late August.
Momentum remained weak as well. The moving average convergence divergence (MACD) histogram turned slightly positive, but both signal lines stayed below zero — a setup indicating improving short-term momentum without confirming a broader bullish reversal.
Rain wrote on X that Bitcoin's apparent demand had turned negative after briefly recovering in August. The analyst said BTC fell toward $76,400 as older coin supply faced weaker absorption, arguing that weakening spot demand mattered more than the $77,000 level itself.
Mixed ETF Flows
U.S. spot Bitcoin ETFs, which launched in January 2024 and have become a closely watched proxy for institutional demand, showed no clear direction this week. Farside Investors data showed the funds posted $236.5 million in net outflows on September 1. BlackRock's IBIT accounted for $201.2 million of that, while Fidelity's FBTC lost $43.7 million.
Flows reversed one session later. Farside data showed the funds attracted $101.1 million on September 2, with BlackRock's fund drawing $115.4 million while Grayscale's GBTC recorded $56.2 million in outflows. That reversal reduced immediate pressure but did not establish consistent institutional demand.
Coinbase had already flagged weak crypto-native demand in its August 7 institutional commentary, saying macro relief had failed to generate stronger Bitcoin upside. Its September 2 market update provided another measure of August's strength, noting BTC gained 25% during the month before slipping alongside stocks and bonds. That placed September's pullback against a much stronger preceding advance, raising the burden on buyers to sustain follow-through above nearby resistance.
Holder Data Shows Selling Pressure Remains Active
CryptoQuant data through September 1 showed 663,215 BTC classified under profit-taking investor behavior, with another 324,767 BTC in the loss-seller cohort. The dataset excluded exchange balances and grouped addresses at the entity level.
CryptoQuant's holder-profit data showed mixed positioning. Short-term holders controlled 9.426% of supply in profit and 2.619% in loss, while long-term holders held 61.033% in profit and 26.923% in loss.
A separate CryptoQuant dataset showed short-term holders generated 48.87% of realized profit activity, with a realized-loss share of 4.092%. Long-term holders contributed 22.694% of realized profits and 24.345% of realized losses.
Those figures showed profit realization had returned without a clear capitulation signal, and supported the view that existing holders alone could not sustain another leg higher. Fresh spot demand remained the main variable for the BTC market.
$75.5K Support in Focus
The first downside area sits near the 100-period exponential moving average around $75,516. A sustained break below that level would weaken the four-hour structure and expose the $73,500 area cited by Rei Researcher.
Rei Researcher said Bitcoin had held above the ETF and short-term-holder cost bases for roughly one week, viewing $73,500 as the first level buyers must defend. Fresh capital, rather than reduced selling, remained the deciding factor.
On the upside, Bitcoin first faces the recent $78,000 to $80,000 resistance region. Jelle wrote on X that BTC remained below key resistance, a break of which could flip market structure. Until that happens, the Bitcoin structure remains range-bound rather than confirmed bullish.
The next verifiable test is a four-hour close above the recent resistance cluster. Failure there keeps $75,516 and $73,500 in focus, while a break above $80,000 would give buyers their clearest confirmation since late August.
