Bitcoin Slips Below $69,000 as 0.618 Fibonacci Break Puts 200-Day Average 6% Overhead
Key Takeaways
- •Bitcoin broke the 0.618 Fibonacci retracement near $69,056 on Friday, extending a three-session decline that had already pushed price below the 200-day moving average on Thursday.
- •The 14-day RSI fell to 24.90, its lowest reading since the June selloff, marking deeply oversold conditions that do not by themselves confirm a bottom.
- •The broken 0.618 level sits within the late-August breakout candle, meaning Bitcoin has re-entered the price zone that launched the autumn rally, with the next support at the 0.786 near $64,036.
- •All three key moving averages now act as overhead resistance: the 200-day at $73,093, the 100-day at $77,792, and the 50-day at $80,631.
- •Friday's close will decide the near-term direction, as a finish above $69,056 could support a bounce toward $72,561-$73,093, while a close under $68,000 would confirm the break and put the 0.786 level in play.
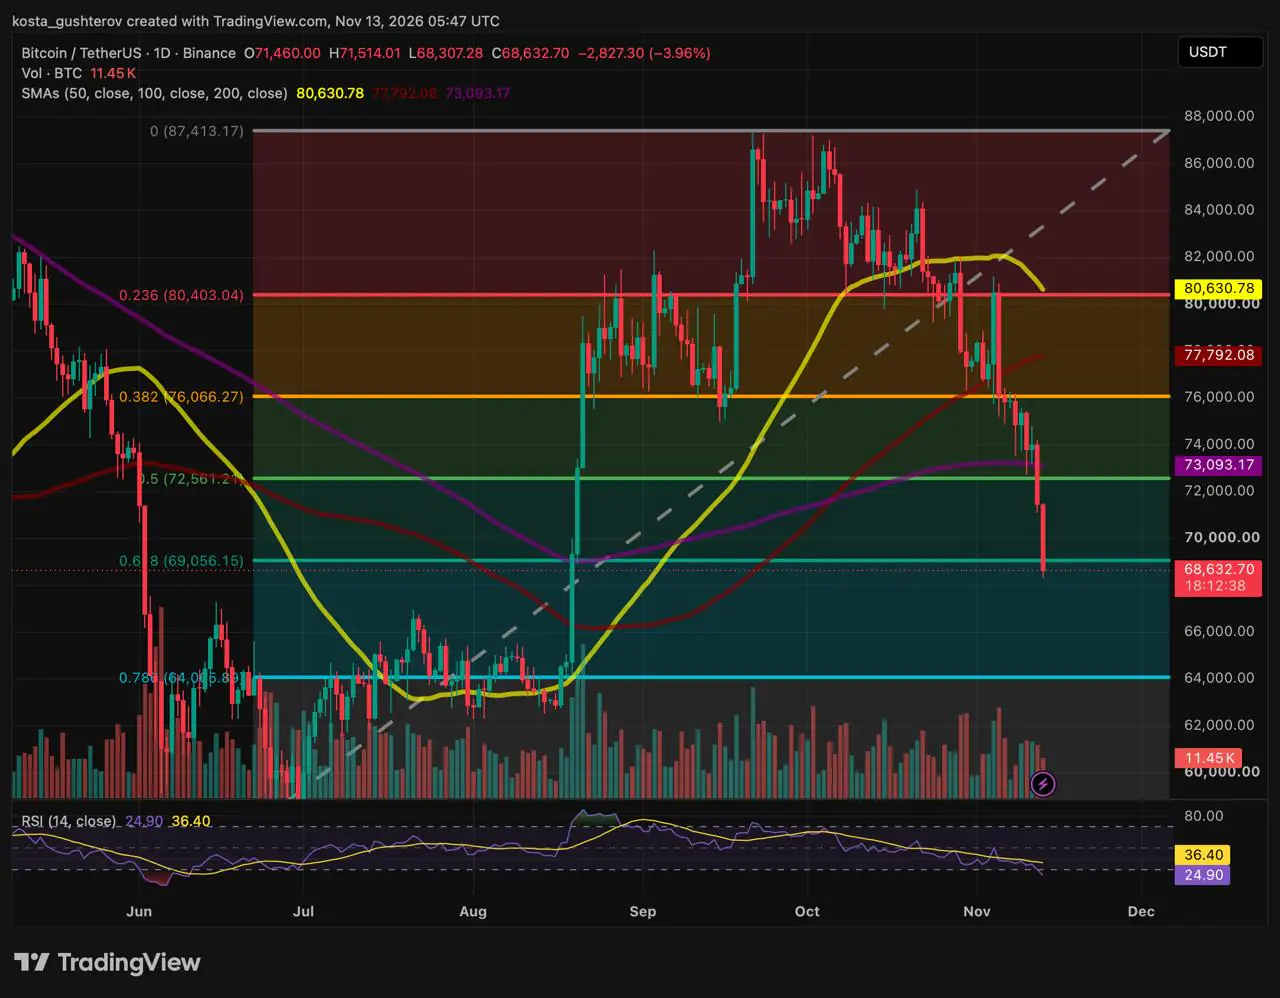
Bitcoin traded at $68,633 on Friday, down 3.96% on the day, after breaking the 0.618 Fibonacci retracement near $69,056 and extending a decline that has now erased two major support levels in three sessions. Readings from the Binance daily chart, taken at 05:47 UTC with just over 18 hours left in the session, showed a low of $68,307 and price sitting closer to the next retracement level at $64,036 than to the 200-day simple moving average it lost a day earlier.
The breakdown has been fast. On Tuesday, Bitcoin was testing its 200-day average from above for the first time since September. By Thursday's close it had fallen beneath that benchmark, ending the session at $71,460. By Friday morning, it had also dropped through the next retracement level, leaving price nearer the 0.786 than the average it had just surrendered.
Coindoo's Tuesday analysis had marked a daily close under the 0.500 Fibonacci around $72,561 as the point at which the 200-day would be surrendered. That threshold gave way on schedule, and two sessions later the decline had reached the 0.618.
Three sessions, three floors
Friday's candle opened at $71,460, managed a high of $71,514 and then fell $3,200 to its low in a straight line. Volume by 05:47 UTC stood at 11.45K BTC — an early figure that says more about the hours to come than the hours already traded.
Back inside the August candle
The retracement grid runs from the summer low near $60,000 to the October peak near $87,413. Grids of this kind divide a completed swing into horizontal bands at fixed ratios of that move, and the 0.618 — derived from the golden ratio — is among the most closely watched retracement marks in technical analysis. The level that just gave way, the 0.618 near $69,056, sits in the middle of the late-August breakout candle — the single session that lifted Bitcoin out of a two-month range between roughly $62,000 and $66,000. The 0.786 near $64,036 marks both the base of that candle and the top of the old range.
That is why $69,000 carried more weight than its 0.618 label suggests. Above it, the decline was a retracement of the autumn rally. Below it, Bitcoin is back inside the move that started the rally, and the next horizontal reference is the range it left in August. From $68,633, the 0.786 is about 6.7% lower; the summer low is about 12.6% lower.
Three averages, all above
The 200-day at $73,093 is the nearest, about 6.5% overhead, and it is the one whose loss changed the trend reading when Thursday closed beneath it. Of the three, the 200-day is the one most commonly treated as the dividing line between a deep correction and a change of trend, which is why its recovery carries the weight it does in the scenarios below. The 100-day at $77,792 is 13% away. The 50-day at $80,631 has begun to roll over and sits just above the 0.236 retracement near $80,403, roughly 17.5% above the current price. Every average that defined the uptrend is now a ceiling, and the closest of them is farther from price than the next support below.
RSI at 24.90 cuts both ways
The 14-day relative strength index (RSI), a momentum gauge scaled from 0 to 100, reads 24.90, well under the 30 line that signals oversold conditions and more than 11 points below its signal line at 36.40. The last time it was this low was the June selloff, which ended with a sharp reversal from a low near $60,000.
The interpretation is two-sided. An RSI under 25 combined with price resting on a Fibonacci level is the setup in which relief bounces usually appear — a point Tuesday's analysis made about the 0.500. But that bounce never came; the 0.500 broke instead, and the 0.618 followed two sessions later. In a decline this impulsive, oversold readings describe how hard the selling has been, not when it stops. The June comparison is a reminder that bottoms can form from here. It is not evidence that one has.
Two paths from $69,000
Both begin with whether the $68,000 to $69,000 area holds on a daily closing basis.
Relief first
If Friday closes back above the 0.618 near $69,056 with the $68,307 low intact, the oversold reading and the reclaimed level together could support a counter-trend bounce. The first targets would be the 0.500 around $72,561 and the 200-day at $73,093, roughly 5.7% to 6.5% higher. A move into that zone on falling volume, followed by a rejection, would keep the trend reading bearish; only a daily-close reclaim of the 200-day, backed by volume, would change it.
Continuation
A daily close under $68,000 would confirm the 0.618 as broken and leave the 0.786 near $64,036 as the next reference, about 6.7% below. That level is also the roof of the July–August range, so a test there would be a test of whether buyers who held Bitcoin at those prices through the summer still want it. Below that, the grid ends at the summer low near $60,000.
What Friday's close decides
The 0.618 was broken before European trading opened, leaving most of the session to determine whether the break sticks. A close above $69,056 would turn Friday into a wick below support with an RSI near 25 underneath — the shape that has started bounces before. A close under $68,307 would make the overnight low the new ceiling for Saturday and put the 0.786 on the table within a single session's range. Either way, the 200-day is the first level that would have to be recovered for any of this to count as more than a pause.
Disclaimer: This article is for informational purposes only and is not financial or investment advice. The levels and scenarios described are based on technical analysis of public chart data and do not guarantee future price movements. Cryptocurrencies are volatile, so do your own research before making any trading or investment decision.

