Bitcoin Tests $87,000 Resistance as Double-Bottom Pattern Targets $114,000
Key Takeaways
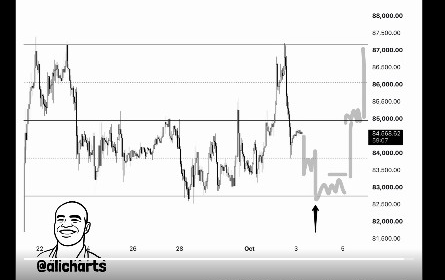
- •Bitcoin traded around $85,000 on Oct. 4 after reversing near $87,000, which analyst Ali Charts identified as the upper boundary of a channel that has capped the price for more than two weeks, with lower channel support near $82,500.
- •Bitcoin whale holdings declined by about 30,000 BTC, valued at roughly $2.52 billion, falling from above 5.25 million BTC to about 5.23 million BTC between September 28 and October 1.
- •A long-term double-bottom spanning 2026, built from a June low near $61,700 and a September recovery toward $82,000, has a neckline near $83,000 and a measured target of roughly $114,000 in the previous all-time-high zone, conditional on confirmation.
- •Analyst Ted Pillows said Bitcoin needs a weekly close above $87,500 to establish a stronger rally setup, warning that failure to clear that level could leave the price exposed to a move below $80,000.
- •Bitcoin continues to trade above key long-term technical levels, including the 200-day moving average near $77,729, the 50-day moving average near $81,310, and the bull market support band around $74,691.
Bitcoin price held near $85,000 on Oct. 4 after failing to sustain a push toward $87,000, with analysts flagging the $87,000–$87,500 region as a key resistance zone following the cryptocurrency's recovery from its mid-2026 lows. On-chain data showed large Bitcoin holders reducing their combined balances over the past week, while a separate long-term chart outlined a possible double-bottom structure whose measured target sits in the previous all-time-high zone near $114,000.
Bitcoin Faces Resistance Near $87,000
Bitcoin climbed toward $87,000 before reversing part of the move. Analyst Ali Charts identified $87,000 as the upper boundary of a channel that has rejected Bitcoin for more than two weeks, and placed the channel's lower boundary near $82,500 — the next downside area if the rejection continues. Channel patterns are a staple of short-term technical analysis, giving traders reference lines for where price has repeatedly bounced and stalled.
The chart shows Bitcoin trading around $84,650 after the latest pullback. A move toward $82,500 would carry the price back to the lower section of the channel. According to Ali Charts, renewed whale accumulation around that level would confirm a rebound toward $87,000 (post on X).
Whale Holdings Move Lower
Bitcoin whale holdings declined by about 30,000 BTC over the past week, a reduction valued at roughly $2.52 billion based on the valuation in the analysis. The whale-holdings chart shows balances falling from above 5.25 million BTC to about 5.23 million BTC between September 28 and October 1, with large-holder balances shrinking as the price traded near the upper portion of its recent range.
Whale-balance metrics draw attention because large holders control a substantial share of circulating supply, so shifts in their positions can change how much Bitcoin is readily available to the market. The data tracks wallet balances only and does not distinguish between selling, moves between a holder's own addresses, or other repositioning.
Ethereum whale holdings moved in the opposite direction over the same period, with the whale-balance metric rising from roughly 3.87 billion to 3.90 billion. XRP whale holdings remained close to 3.90 billion XRP, with the chart showing limited movement throughout the window.
Double-Bottom Pattern Targets the ATH Zone
A separate long-term chart shared on X shows a large double-bottom formation spanning 2026. The pattern took shape after Bitcoin declined toward the $61,700 area in June and then recovered toward the $82,000 resistance region in September. The neckline sits near the $83,000 area on the chart, and Bitcoin has moved above that level and is now testing the breakout area.
If the double-bottom structure confirms and the move continues higher, the measured target is roughly $114,000, placing Bitcoin's projected objective in the zone of its previous all-time high — though the target remains conditional on confirmation. Prior all-time-high territory tends to be treated as a significant zone in technical analysis because it marks the price area of the market's earlier peak. A double-bottom forms when price records two comparable lows before recovering toward shared resistance; a breakout above the neckline allows a price target to be projected from the pattern's height (chart on X).
Weekly Close Remains the Key Level
Analyst Ted Pillows said Bitcoin needs a weekly close above $87,500 to establish a stronger rally setup, and noted that a failure to clear that level could leave the price exposed to a move below $80,000. Weekly closes are given more weight than intraday moves in technical analysis because they show whether a level has held across a full week of trading.
On the longer-term picture, Bitcoin trades above several key technical levels after the mid-2026 decline: the 200-day moving average near $77,729, the 50-day moving average near $81,310, and the bull market support band shown around $74,691. The 200-day moving average is commonly read as a-term trend gauge, the 50-day as a nearer-term one, and the bull market support band as a two-line measure used to track bull-market conditions.
The current technical structure leaves several price levels in focus. Bitcoin now faces resistance around $87,000, and $83,000 remains central to the double-bottom setup. A break and sustained move above $87,500 would draw attention to higher resistance and the double-bottom target near $114,000, while a rejection below $87,000 could send Bitcoin back toward the $82,500 channel support.
This article is for informational purposes only and does not constitute financial or investment advice. Technical patterns, whale-balance data and analyst targets do not guarantee future Bitcoin performance.
Source: The Market Periodical — https://themarketperiodical.com/2026/10/04/bitcoin-price-prediction-btc-double-bottom-points-toward-ath-zone/

