Bitcoin Wobbles Near $76,000 After Jobs Beat, With CPI and Fed Decision Next
Key Takeaways
- •Bitcoin traded at $75,916 by 14:00 UTC on Friday, down $172 or 0.23%, with the session's entire range sitting below its 100-day simple moving average for the first time in the sequence.
- •October U.S. payrolls rose 165,000, far above the 65,000 expected and the 48,000 prior 12-month average, while August and September estimates were revised up by a combined 84,000 jobs and unemployment held near 4.1%.
- •Steady hiring and rising wages reduce the case for Federal Reserve rate cuts, and higher yields make holding non-yielding Bitcoin relatively more costly, draining liquidity from risk assets.
- •Wednesday's rally to the 0.236 retracement near $80,403 failed and was engulfed Thursday by a heavy-volume red candle that closed below the 100-day SMA at $77,116, while Friday sank to a lower low of $75,304 with a rebound of only about $600 versus more than $4,600 earlier in the week.
- •The 14-day RSI reads 38.06 against its signal line at 40.44 after a failed bullish crossover, and upcoming data including the October CPI on November 10 and the Fed's December 9 rate decision will determine whether the pressure on Bitcoin builds or fades.
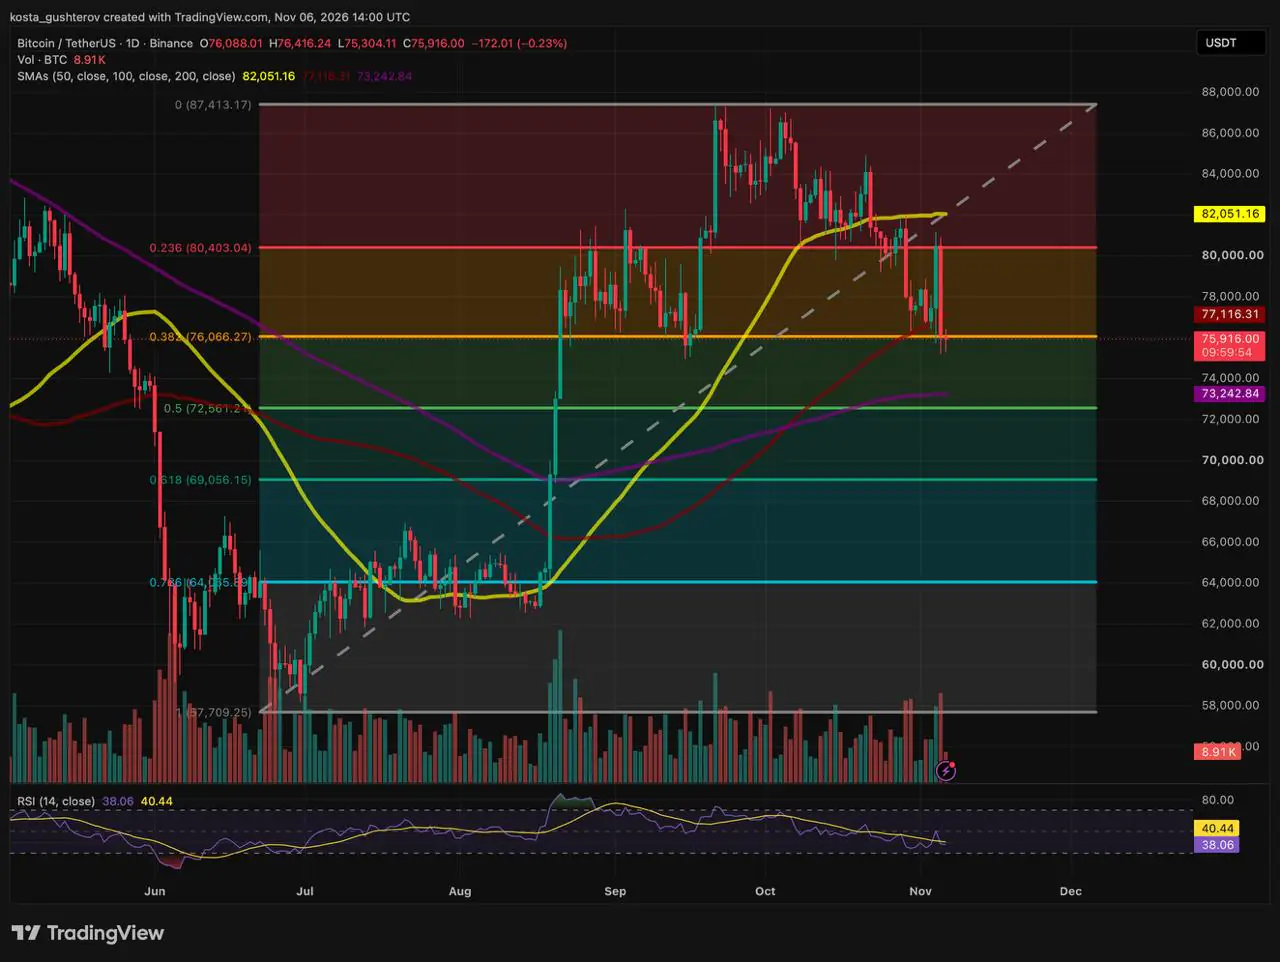
The October U.S. employment report landed on Friday with Bitcoin already trading below a key retracement level, and the data did little to change that picture. CoinDesk reported the price holding around $75,800 in the minutes after the Bureau of Labor Statistics release. By 14:00 UTC, half an hour after the figures came out, BTC traded at $75,916, down $172, or 0.23%, with the session's entire range to that point sitting below its 100-day simple moving average for the first time in this sequence.
Wednesday's rally ran out near $80,403
The week's sequence began with a test of the floor. On November 4, Bitcoin dipped below the 0.382 Fibonacci retracement near $76,066, and buyers answered quickly. The green candle that followed reclaimed the 100-day SMA and pushed briefly through the 0.236 retracement near $80,403, but Bitcoin could not hold above it, and the session left a long upper wick at that level. The reversal that followed turned the brief break into a bull trap.
Thursday's reversal and a weaker Friday bounce
Sellers took over at the top of that move on Thursday. A full-bodied red candle, printed on one of the heaviest volume bars since late September, ran from the $79,000–$80,000 region back to $76,088. It engulfed almost all of Wednesday's recovery and closed below the 100-day SMA at $77,116. Across the broader market, crypto gave back its early-week rally in the same session.
Friday opened at $76,088, right on the 0.382 retracement. The first bounce reached only $76,416, about $700 short of the 100-day SMA, before sellers pushed Bitcoin to $75,304, below Wednesday's dip.
A shelf that gives way a little more each time
Across the three sessions, the price action has shifted from defending support to pressing against it. Wednesday's bounce gave Bitcoin a chance to set a higher low above the 100-day SMA. Instead, the rally failed at the 0.236 level and was engulfed the next day. Friday then lost the average outright, failed to touch it even on the intraday bounce, and printed a lower low. Taken together, the sequence suggests that the resting buy orders sitting on the 0.382 shelf are being steadily worked through.
The size of each bounce points the same way. Wednesday's dip below the shelf drew a rebound of more than $4,600. Friday's deeper dip has so far produced a recovery of roughly $600 from the low, on 8.91K BTC of volume with about 10 hours of the session remaining. Each test of the 0.382 level is drawing less buying than the last.
Momentum has rolled over with price. Earlier in the week, the 14-day RSI climbed up to its signal line, and Thursday's drop pushed it back under before a bullish crossover could take hold. It now reads 38.06 against a signal line at 40.44. A failed crossover below the 50 midline leaves momentum with sellers for now.
What the jobs report changes for Bitcoin
The October payroll gain of 165,000 came in far above expectations of 65,000 and well above the 48,000 average of the prior 12 months. The bureau also revised its August and September estimates up by a combined 84,000 jobs. The unemployment rate was little changed at 4.1%, while average hourly earnings rose 0.4% to $38.00, a 3.1% annual pace.
For Bitcoin, the link runs through interest rates. Steady hiring with pay still climbing gives the Federal Reserve less reason to cut and more room to keep policy tight. Higher yields raise what investors can earn on cash and government bonds, which makes holding an asset with no yield, such as Bitcoin, relatively more costly and tends to drain the liquidity that risk assets rely on.
The bigger signal is where yields sit. The 10-year yield has fallen from above 5.3% in early October, and Friday's low of 4.818% held just above its own 100-day SMA at 4.808%. Bitcoin lost its 100-day SMA on Thursday, so the two charts are now testing the same kind of level from opposite sides. Bitcoin slid through the past month even as yields eased, which shows how little room it has if that easing reverses.
The initial market reaction was modest, so the report reads less as a fresh trigger than as added pressure on a chart that was already weak. Whether that pressure builds or fades depends on the data still to come.
The calendar ahead
With the jobs report absorbed, attention turns to the inflation calendar. The October CPI report lands on November 10 at 13:30 UTC and will show whether firmer pay is feeding into prices. A hot reading on the heels of this jobs report would strengthen the case for tight policy, while a soft one would take some pressure off yields. October producer prices follow on November 13 with an early read on cost pressure in supply chains, and the November jobs report on December 4 will show whether hiring holds this pace. All of it feeds into the Fed's December 9 rate decision, the last of 2026, which comes with updated economic projections.
What Friday's close decides
Where Friday's daily candle settles against the 0.382 retracement sets the tone for the next move.
Buyers need a late reclaim. Lifting BTC back above the 0.382 near $76,066 and the $76,416 session high before the close would turn the drop to $75,304 into a second flush below the shelf. Saving the shelf alone would not undo Thursday's damage, though. A daily close back above the 100-day SMA at $77,116 would be needed to neutralize the engulfing candle and put the 0.236 retracement near $80,403 back in reach.
Sellers need less. A daily close beneath the 0.382 retracement, followed by a break of the $75,304 low, would leave little in the way of structure above the rising 200-day SMA at $73,243 and the 0.5 retracement around $72,561 — a support cluster roughly 3.5% to 4.4% below the current price.
Neither path changes the larger frame on its own. The 50-day SMA at $82,051 caps the range beyond $80,403, so even a full recovery would leave Bitcoin trading under its shortest trend average. The moving averages still stack in bullish order, with the 50-day above the 100-day and the 100-day above the 200-day. That means a drop toward $73,243 would test the longer trend rather than confirm it has turned.

