Bitcoin Slips Below $64,000 as Oil Rally and ETF Outflows Weigh on Market
Key Takeaways
- •Bitcoin declined approximately 1.44% to near $63,916, trading below $64,000 amid rising oil prices and stalled US-Iran negotiations.
- •US spot Bitcoin ETFs recorded $144.67 million in net outflows on Monday, breaking a five-day streak of consecutive inflows.
- •Market participants increased the probability of a 25-basis-point rate hike at the Fed's September meeting to 51.3%, up from 44.1% on Friday.
- •Bitcoin's near-term technical structure remains bearish, with the cryptocurrency trading beneath the 50-day, 100-day, and 200-day Exponential Moving Averages.
- •Immediate support for Bitcoin sits at $62,345, and a decisive break below could trigger a deeper pullback toward the July 1 yearly low of $57,800.
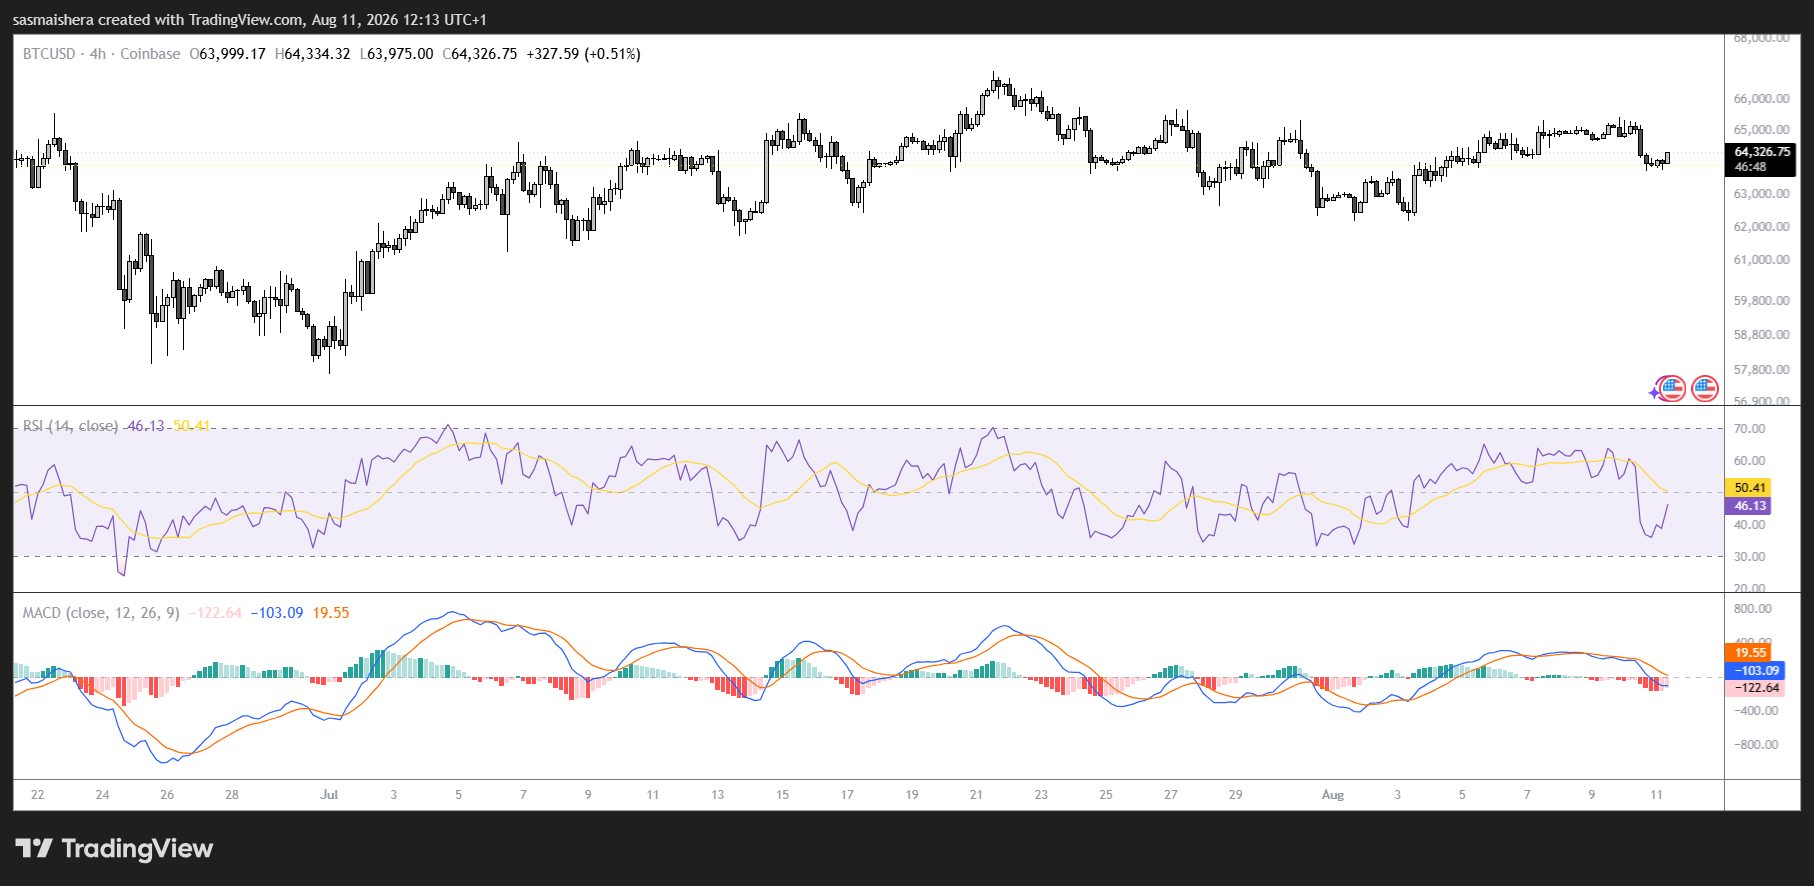
Bitcoin (BTC) is trading below $64,000 as rising oil prices and uncertainty surrounding US-Iran negotiations pressure risk-sensitive assets. The largest cryptocurrency by market capitalization was changing hands near $63,916 on Tuesday, having declined 1.44% in the previous session, with weakening institutional demand compounding the bearish sentiment. Bitcoin has moved in tandem with broader risk assets throughout 2024, with its price showing heightened sensitivity to shifts in Federal Reserve policy expectations and geopolitical developments.
US-Iran Deadlock Drives Oil Higher
Diplomatic efforts between the United States and Iran appear to have stalled, with negotiations over a potential peace agreement and the reopening of the Strait of Hormuz reaching an impasse. According to Reuters, US President Donald Trump responded to Iran's conditions for a peace agreement on Monday by introducing additional demands, including compensation for individuals killed in wars, attacks, and protests.
The escalating rhetoric threatens to complicate diplomatic progress and delay the reopening of the Strait of Hormuz, a critical corridor for global energy shipments through which roughly one-fifth of the world's daily oil consumption transits. Fears of prolonged disruption have sent oil prices higher, placing downward pressure on risk assets such as Bitcoin.
A sustained rise in energy prices could elevate production and transportation costs, reigniting inflationary pressures. Higher inflation may, in turn, provide the Federal Reserve with additional justification to maintain restrictive monetary policy or raise interest rates further.
Market expectations for another rate increase have strengthened in tandem with the oil rally. The CME FedWatch Tool indicates that market participants now assign a 51.3% probability to a 25-basis-point rate hike at the Federal Reserve's September meeting, up from 44.1% on Friday. Higher interest rates typically dampen demand for speculative assets by increasing borrowing costs and making interest-bearing instruments more attractive. Throughout 2024, Bitcoin has repeatedly pulled back during periods when rate-hike expectations firmed, underscoring its sensitivity to the cost of capital.
ETF Outflows End Five-Day Inflow Streak
Institutional demand for Bitcoin showed signs of cooling at the start of the week. US spot Bitcoin ETFs recorded $144.67 million in net outflows on Monday, according to SoSoValue, breaking a five-day streak of consecutive net inflows.
ETF flows are widely monitored as a barometer of institutional and traditional-market investor demand. Since their approval by the SEC in January 2024, spot Bitcoin ETFs have become a primary vehicle for institutional and retail exposure to BTC, making daily flow data a closely watched signal of sentiment shifts. Sustained inflows tend to support Bitcoin's price through spot-market buying, while persistent outflows can exacerbate selling pressure.
While a single day of withdrawals does not necessarily signal a broader trend, continued outflows throughout the week could deepen Bitcoin's correction and further erode investor confidence. Market participants are also watching whether ETF flow patterns correlate with upcoming inflation data releases, which could further shape expectations for the Fed's September decision.
Technical Picture: Bitcoin Below Key Moving Averages
Bitcoin's near-term technical structure remains bearish, with the cryptocurrency trading beneath a cluster of significant Exponential Moving Averages (EMAs). The 50-day EMA at $64,625 serves as the nearest overhead resistance. Above that, the 100-day EMA at $66,795 and the 200-day EMA at $72,045 present additional barriers. With all three averages stacked above the current price, BTC faces considerable resistance on any attempted recovery.
Momentum indicators echo the lack of buying conviction. The Relative Strength Index (RSI) sits near 48, just below its neutral midpoint of 50. Meanwhile, the Moving Average Convergence Divergence (MACD) line hovers marginally below zero and in close proximity to its signal line, reflecting tepid and largely directionless momentum rather than a confirmed bullish reversal.
On the upside, Bitcoin would need to reclaim the 50-day EMA at $64,625 to improve its short-term outlook. A sustained breakout above this threshold could open the path toward the 100-day EMA at $66,795. Further gains would place the 200-day EMA at $72,045 and the broader horizontal resistance at $75,719 in focus.
On the downside, immediate support is situated at $62,345. Should geopolitical and macroeconomic headwinds persist, buyers may attempt to defend this zone. A decisive daily close below $62,345, however, would reinforce the bearish outlook and could precipitate a deeper pullback toward the yearly low of $57,800, established on July 1.

