Bitcoin Weekly Chart Flashes a Warning Near $78K
Key Takeaways
- •Bitcoin changed hands near $83,978 on Saturday, September 26, about 7% above a cluster of 50-, 55-, and 100-week EMAs bunched between roughly $77,800 and $78,600.
- •The week of September 7 closed at $76,842 below the moving-average band before the next weekly candle finished at $81,178, confirming a retest that has held so far.
- •The 8-week EMA, near $77,000, has not yet crossed above the slower averages, so the moving-average ribbon has yet to flip to a bullish configuration.
- •A weekly close back below $78,000 would put the entire breakout in doubt, while a one-hour close above $84,296.60 would open targets at $85,224 and $87,385.10.
- •Bitget reported unauthorized transfers from its hot wallets beginning September 24, with estimates revised upward from $351.6 million to $387.5 million, while Bitcoin's 24-hour change was roughly flat at -0.1%.
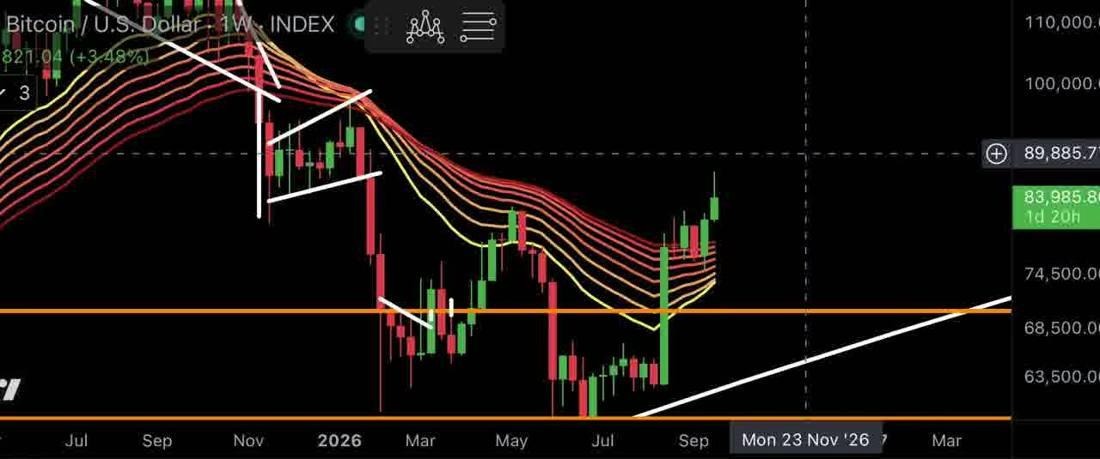
Bitcoin's weekly candles now trade above a dense cluster of moving averages, and the upper edge of that band, near $78,000, is where the current breakout faces its first serious test.
The observation, drawn from Binance BTCUSDT candles and TradingView's BTCUSD weekly chart, centers on a thick band of long-term moving averages sitting just below spot price — the level that will determine whether the recent advance holds or gives way.
The asset changed hands near $83,978 at 09:00 UTC on Saturday, September 26, and the weekly chart looks materially different than it did a month ago. Price has climbed on top of a stack of moving averages that spent much of the year acting as resistance.
Weekly exponential moving averages (EMAs) on Binance BTCUSDT candles lay out the structure plainly. Each line tracks the average weekly close over its lookback window, weighting recent weeks more heavily, so when several long-period lines bunch at one price they read as a single zone rather than separate levels. The 50-, 55-, and 100-week lines bunch between roughly $77,800 and $78,600, while the 21-week EMA sits near $73,700. Faster averages are still creeping toward the slower ones. The 8-week EMA, near $77,000, has yet to cross above them.
A Ribbon That Hasn't Flipped
On the TradingView weekly chart, the colored moving-average ribbon slopes down through winter and spring, then flattens as candles push through it in August. The week of August 17 did much of the work: Bitcoin opened that week near $62,900 and closed at $77,734.
Source: TradingView BTCUSD weekly chart, moving-average ribbon with price above its upper edge
The cluster has already been tested once. The week of September 7 closed at $76,842, below the band, before the following weekly candle finished at $81,178 — a retest that has held so far.
Chart analysts typically want faster averages to cross above slower ones before calling a bear phase over. That crossover has not yet occurred, meaning the ribbon has yet to flip. The 8-week line's path relative to the cluster is therefore the most direct part of this chart to watch.
Why $78K Matters More Than $84K
Price sits about 7% above the band. Bitcoin's median daily range over the past 30 days has been 2.5%, and the 14-day average true range (ATR) is close to $2,459 — just under 3% of spot price. A slide back to the band's top edge would require a little more than two average daily swings — a plausible move, though not a forecast.
Some traders expect a return to the upper edge before any extended advance, while others believe price simply continues higher. The chart alone does not settle the question. A weekly close back below $78,000, however, would put the entire breakout in doubt. Because the reading was taken on a Saturday, that week's candle was still open — the weekly close that would settle the question sat roughly a day and a half away.
Closer to spot price, a ladder of reference levels sits below. Binance data placed the prior week's high at $81,933.90 and August's monthly high at $81,500. Below those come swing highs from September 11 and 14 at $79,859.80 and $79,570.90, with the month's open at $78,549.60 just beneath them.
Other Headlines in the Background
Bitget said unauthorized transfers began from its hot wallets on September 24, initially estimated at $351.6 million and later revised up to $387.5 million. Bitcoin's 24-hour change was roughly flat -0.1%, with no sign the incident dragged the asset lower.
Levels That Could Decide the Next Move
For the upside, a one-hour close above $84,296.60 — the session high so far — would open $85,224 and then $87,385.10, September's high. Should price slip back below $83,875 on a one-hour close, that scenario is invalidated.
Sellers have a route as well. A one-hour close below $83,750 would bring $83,130.10 into play, then $82,832. That bearish setup would be off the table if a one-hour candle finished back above $84,168.75 first.
Zooming out, the broader backdrop remains constructive. Bitcoin trades above a rising 100-day moving average near $69,500, roughly 3.9% below its 20-day high, and remains within its recent range.
None of this is financial or investment advice. It is news and chart commentary only.

