Arbitrum (ARB) Jumps 5% as Triple Support Cluster Holds Near $0.186
Key Takeaways
- •ARB climbed roughly 5% on Wednesday, pushing through the descending trendline that had capped its price action since the September high.
- •The token trades about 169% above its mid-August low near $0.073 while remaining roughly 22% below its September peak of $0.255.
- •A dense support zone has formed near $0.186, where the 0.382 Fibonacci retracement, the 50-day moving average, and the broken downtrend line sit within a band less than a cent wide.
- •The 14-day RSI has climbed to about 53, and the 50-, 100-, and 200-day moving averages are all rising, supporting the recovery.
- •Wednesday's candle had not yet closed, and a daily close back under the support band would turn the breakout into another failed rally.
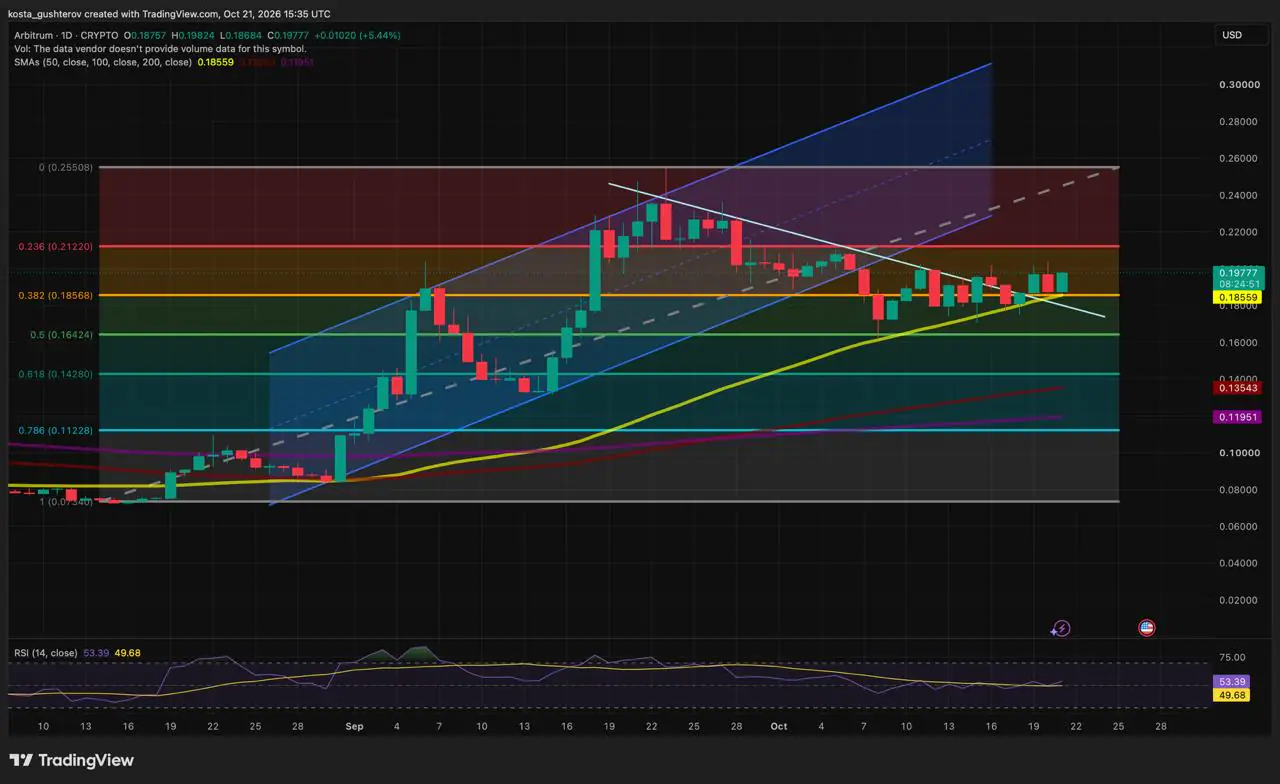
Arbitrum's ARB token jumped roughly 5% on Wednesday, extending a breakout from the descending trendline that had capped its price action since September. According to the ARB daily chart on TradingView, the rebound leaves the token about 169% above its mid-August low near $0.073, although it still trades roughly 22% below its September high of $0.255.
For readers newer to the asset, Arbitrum is an Ethereum Layer 2 network that handles transactions off the main chain before settling them on Ethereum, and ARB is the ecosystem's governance token, giving holders voting power in the Arbitrum DAO.
From September Peak to October Base
ARB's August rally added nearly 250% before topping out in late September. The slide that followed broke the rising channel the token had tracked since late August, and on October 8 a wick reached the 0.5 Fibonacci level near $0.164 before buyers stepped in.
The token then spent roughly two weeks building a base between approximately $0.17 and $0.20. Over the past few sessions it has pushed through the descending trendline from the September high, and Wednesday's green candle extends that break.
Support Stacks Up Just Below the Price
The recent retracement found its footing at the 0.382 Fibonacci level of the August rally, and the 50-day simple moving average (SMA) has climbed to almost exactly the same price near $0.186. The broken downtrend line now sits just underneath both. With three lines packed into a band less than a cent wide, this is the level buyers most need to hold.
Resistance Starts at $0.205
The top of the October base near $0.205 has turned back at least three rallies since mid-October, including Tuesday's attempt. Slightly higher, the 0.236 Fibonacci level near $0.212 sits about 7% above the current price. It held as the floor of the late-September consolidation before breaking down at the start of October, so it could cap the next leg up.
Momentum indicators back the move so far. The 14-day relative strength index (RSI) has climbed to about 53, crossing back above its signal line while staying well short of overbought territory. The longer-term averages also support the recovery: the 50-day SMA sits above the 100-day near $0.135 and the 200-day near $0.120, and all three are still rising.
Where the Bounce Could Fail
The bigger structure has not flipped yet. Each rally since the September peak has topped out lower than the one before, and Wednesday's candle has yet to close. A daily close back under the support band would turn this week's breakout into another false start.
What to Watch Beyond the Chart
Three dates could matter as much as any level on the chart. The token supply documentation published by the Arbitrum Foundation provides the official schedule for the dates ahead. The same documentation lays out how allocated ARB unlocks over time, so scheduled supply increases land on dates readers can verify in advance. That is one reason token calendars get tracked alongside chart levels.
Is It ARB or the Whole Market?
Bitcoin and Ether also rose on Wednesday, but by smaller margins, with gains of roughly 1% to 3% depending on the time window. ARB's jump outpaced both, so the bounce is more than the broader market lifting every token. The governance calendar adds another layer for this specific token: Arbitrum DAO votes can direct treasury spending and protocol upgrades, so Thursday's session carries practical consequences for the ecosystem. Whether those votes are playing a part is something the chart alone cannot show.
How the Chart Was Read
The analysis is based on daily ARB/USD candles on TradingView, captured at 15:35 UTC on October 21, 2026, with the day's candle still open; daily candles close at 00:00 UTC. Fibonacci levels run from the mid-August low to the late-September high. Indicators used are the 50-, 100- and 200-day simple moving averages and the 14-day RSI.
This article is provided for informational purposes only and does not constitute financial advice. Cryptocurrency prices are volatile.
This article originally appeared on Coindoo.

