Yen Intervention, Fed Dissent, and Expanding Middle East Conflict Shape Markets
Key Takeaways
- •The U.S. Treasury and Bank of Japan jointly intervened in the yen market, sending the currency 3.1% higher and raising concerns about potential disruption to trillions in yen-funded carry trade positions.
- •Three FOMC members dissented in favor of a rate hike, and the probability of a September rate increase has risen to approximately 75%.
- •Advance Q2 GDP growth slowed to 1.5% against expectations of 2.1%, while the PCE price index accelerated to 5.1%, signaling potential stagflation as economic growth stalls alongside persistent inflation.
- •The Middle East conflict has expanded to involve the U.S., Israel, Iran, and multiple Gulf states, with both the Strait of Hormuz and the Bab el-Mandeb simultaneously impaired, threatening nearly half of global oil supply.
- •Global bond yields continued climbing, with the U.S. 30-year Treasury yield reaching 5.28%, its highest since 2004, in what represents the worst bond market decline since the 1970s.
Yen Intervention, Fed Dissent, and Expanding Middle East Conflict Shape Markets
David Chapman
The past week was relatively quiet in terms of broad market movement, though trading ranges were notable in certain areas. The United States and the Bank of Japan (BOJ) intervened jointly in the Japanese yen market, triggering a sharp rally for the currency—a move with significance well beyond Japan, given the yen's central role in global carry trades where investors borrow yen cheaply to fund higher-yielding investments elsewhere. The Federal Open Market Committee (FOMC) met during the week and, as widely anticipated, left interest rates unchanged. However, three FOMC members dissented, voting in favor of a rate hike. Markets reacted negatively to the split vote, selling off before recovering to finish the week with modest gains.
Fed Governor Kevin Warsh provided no forward guidance and struck a dovish tone in his post-meeting remarks, contrasting with the three dissenters seeking tighter policy. Bond yields rose amid the conflicting signals. Odds of a rate hike at the September FOMC meeting have climbed to approximately 75%.
The broader market picture remains negative despite the stock market's bounce. Interest rates rose while the U.S. dollar fell—a combination that runs counter to typical expectations, since higher yields normally attract capital and strengthen the dollar. Gold and silver finished the week slightly lower, but platinum, palladium, and copper all advanced. Oil prices declined before a late-week rebound.
- Reference to the Enriched Capital Conservative Growth Strategy and its investments, celebrating an 8.42-year history of 204% growth (annualized 14.17%), is provided by Margaret Samuel, President, CEO, and Portfolio Manager of Enriched Investing Incorporated, who can be reached at 416-203-3028 or msamuel@enrichedinvesting.com. This information should not be construed as an offer, or a solicitation of an offer or sale of any security. Past performance does not guarantee future returns.
Quotations
"Iraq is a very wealthy country. Enormous oil reserves. They can finance, largely finance the reconstruction of their own country."
— Richard Perle, American political advisor, assistant secretary of defense for global strategic affairs under Ronald Reagan, also advisor to Donald Rumsfeld in the Bush administration; supported the claim that Iraq held weapons of mass destruction; b. 1941
"Petroleum is a more likely cause of international conflict than wheat."
— Simone Weil, French philosopher, mystic, political activist; 1909–1943
"In this century wars will not be fought over oil, as in the past, but over water."
— Clive Cussler, American adventure novelist, underwater explorer; listed on the New York Times fiction best-seller list 20 times; 1931–2020
The Federal Reserve
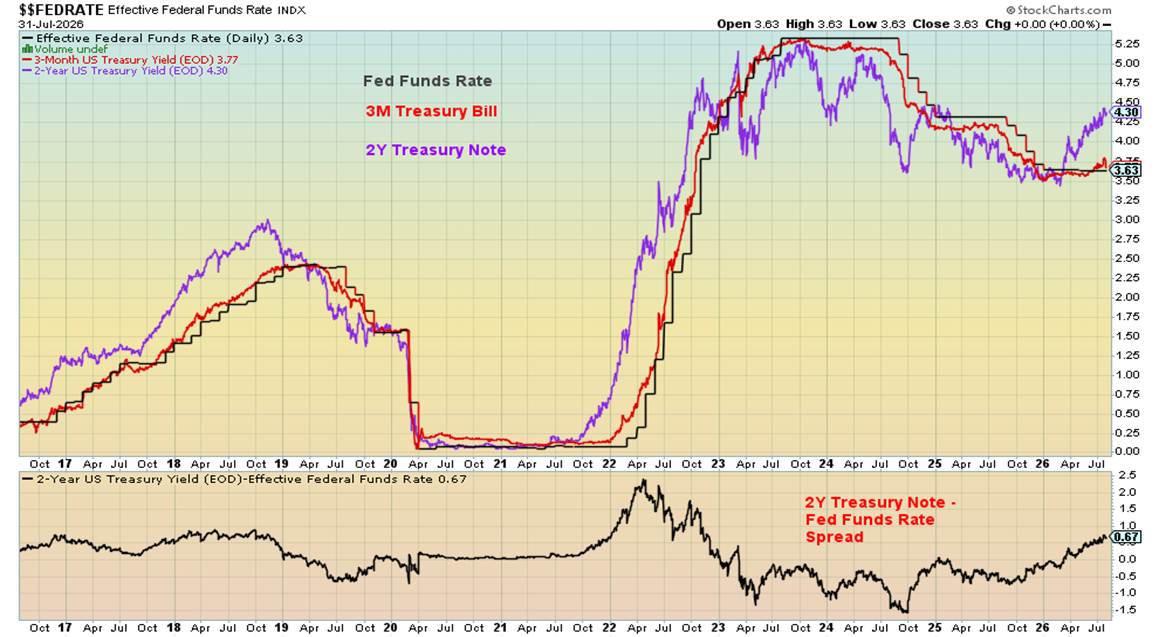
As generally expected, the Fed left interest rates unchanged at its FOMC meeting. The United Kingdom and Japan also held their rates steady. The Fed's vote, however, was not unanimous: three FOMC members dissented, advocating for a rate hike. Given the potential for rising inflation tied to resumed hostilities between Iran and the U.S. and the resulting increase in oil prices, a hike at the September FOMC is a strong possibility. The odds of a September rate hike now stand at roughly 75%.
With Fed Governor Kevin Warsh no longer providing forward guidance, the FOMC's internal thinking is difficult to assess. His post-meeting speech was dovish, in contrast to the three hawkish dissenters. Warsh appears caught between Trump's push for lower interest rates and the Fed's data-dependent mandate. U.S. borrowing costs have reached their highest level since 2007. Federal government debt now stands at $39.7 trillion, up from $10.4 trillion in 2008—an almost fourfold increase.
Total U.S. debt—encompassing federal, state, municipal, corporate, banking, and household sectors—was $50.5 trillion in 2008. It now totals $113.6 trillion, more than double the 2008 figure. The federal debt surge was driven by the 2008 financial crisis and the 2020 pandemic. These figures exclude the shadow banking system, which is dominated by private equity, private credit, and hedge funds. That sector operates largely outside traditional regulatory frameworks and employs significant leverage, making it a potential epicenter for a future debt crisis.
Jerome Powell's term as Fed governor was not renewed because he refused to comply with Trump's wishes. Trump has stated that Warsh wants lower interest rates and has accused dissenting FOMC members of acting politically. Warsh, holding only one vote on the FOMC, could find himself squeezed between the administration and his colleagues. At the most recent meeting, three members sought higher rates while nine voted to hold.
The latest advance Q2 GDP report added to the Fed's challenges. Growth came in at 1.5%, below the prior reading of 2.1% and below expectations of 2.1%. The advance Q2 PCE (Personal Consumption Expenditures price index) was 5.1%, compared to 4.6% previously and expectations of 4.0%. However, the year-over-year June PCE slowed to 3.7% from 4.1%, roughly in line with expectations—though that moderation coincided with a month of declining oil prices and may prove temporary. The combination of a slowing economy and rising inflation points toward stagflation—the difficult condition in which stagnant growth and persistent inflation coexist, limiting policy options since addressing one risk tends to worsen the other—complicating the Fed's path.
Market reaction was mixed. The stock market, already under pressure, fell further before rebounding the following day, though the trend appears to be turning down. Bond yields rose. Gold, which typically reacts negatively to rising yields, rallied instead—a divergence that could be a positive signal. The U.S. Dollar Index fell further, aided by the weaker-than-expected Q2 GDP. Dollar weakness in the face of rising interest rates is notable and is ultimately supportive for gold.
Gold
Gold prices historically rise when the Consumer Price Index (CPI) increases and money supply (M1) grows. This relationship has been especially pronounced since August 1971, when President Nixon ended the convertibility of the U.S. dollar into gold, cementing the dollar's reserve currency status. The gold standard, while constraining, had helped restrain inflation, money supply growth, and debt. After its abandonment, fixed exchange rates became floating rates, and debt, money supply, and inflation all surged—with gold following or perhaps leading the way.
With debt still rising, inflation rebounding, and money supply growth resuming, another increase in gold prices appears likely. Since peaking in January 2026, gold has been in a steady decline. The escalation of the Iran/U.S./Israel conflict on February 28, 2026 pushed interest rates higher, which pressured gold. Since the outbreak of that war, gold has fallen over $1,300, or 24%. Silver has dropped 61%, while gold stocks have fallen sharply—the Gold Bugs Index (HUI) down 36% and the TSX Gold Index (TGD) down 33%. Over the same period, the 2-year U.S. Treasury note yield rose 88 basis points (26%) and the 10-year Treasury note yield climbed 72 basis points (18%).
More recently, even as bond yields have continued rising, gold has held above $4,000 and is now responding positively to higher yields—a departure from its usual behavior that could signal an impending recovery.
The Gold Miners Bullish Percent Index has lingered in oversold territory since March. Over the past decade, this represents both the lowest reading and the longest sustained period of oversold conditions for gold miners. Previous comparable lows occurred in 2008, 2013, and 2015—periods when gold had fallen sharply and miners even more so. After the 2008 low, gold and gold miners rose to record levels. While 2013 did not mark the final low, the 2015 low proved to be an important cyclical bottom.
Chart of the Week: The VIX
The CBOE Volatility Index (VIX) measures the market's expectation of 30-day volatility for the S&P 500. Values above 30 generally indicate heightened market fear and uncertainty, while readings below 20 suggest relative stability. The VIX was introduced in 1993 and became a key indicator of U.S. equity market volatility. In 2003, the methodology was redesigned with input from Goldman Sachs.
For analytical purposes, readings above 40 are treated as indicating extreme fear, while levels below 15 suggest complacency. Since 1990, there have been nine instances of extreme fear. These episodes tend to be brief but dramatic. Periods of complacency, by contrast, can persist for months or even years.
Since 1990, four extended complacency periods have occurred: 1992–1996, 2004–2007, 2012–2015, 2016–2020, and 2023–2024. Each was followed by a crisis, a sharp market decline, and a spike to extreme fear.
VIX Spikes 1990–2026
| # | Fear Event | Year | DJI Decline |
|---|---|---|---|
| 1 | Russia default / LTCM crisis | 1998 | down 19.3% |
| 2 | Dot.com crash / 9-11 | 2001–2002 | down 37.8% |
| 3 | Financial crisis / Great Recession | 2008 | down 53.8% |
| 4 | EU / Greek debt crisis | 2011 | down 16.8% |
| 5 | China market crash, commodity collapse, Fed hike fears | 2015/2016 | down 14.5% |
| 6 | Inflation fears, crowded volatility trades | 2018 | down 19.6% |
| 7 | COVID-19 pandemic | 2020 | down 37.1% |
| 8 | Unwinding of yen carry trade, weak job growth | 2024 | down 7% |
| 9 | "Liberation Day" tariffs | 2025 | down 18.8% |
Note: In 2022, the DJI fell 22.4% on inflation fears, but the VIX remained below 40 as the decline was choppy. In 2024, the DJI decline was modest and the VIX spiked only briefly before retreating as no crisis materialized.
The VIX has been rising but has not yet spiked into extreme fear territory. The CNN Fear and Greed Index is registering a modest level of fear. Global risk appetite is declining and market volatility is increasing, though the market is not yet in a danger zone.
Markets and Trends
| Index/Asset | Close Dec 31/25 | Close Jul 31/26 | Week | YTD |
|---|---|---|---|---|
| S&P 500 | 6,845.50 | 7,489.72 | 1.1% | 9.4% |
| Dow Jones Industrials | 48,063.29 | 52,485.03 | 1.0% | 9.2% |
| Dow Jones Transport | 17,357.19 | 21,039.30 | (6.4)% | 21.2% |
| NASDAQ | 23,241.99 | 25,373.85 | 1.6% | 9.2% |
| S&P/TSX Composite | 31,712.76 | 35,226.14 (new highs) | (0.4)% | 11.1% |
| S&P/TSX Venture (CDNX) | 987.74 | 867.13 | (0.2)% | (12.2)% |
| S&P 600 (small) | 1,467.76 | 1,768.56 | 0.4% | 20.5% |
| ACWX MSCI World x US | 67.18 | 75.23 | 1.6% | 12.0% |
| Bitcoin | 87,576.98 | 62,921.23 | (2.0)% | (28.2)% |
| Gold Bugs Index (HUI) | 701.49 | 617.73 | (1.3)% | (11.9)% |
| TSX Gold Index (TGD) | 817.76 | 735.70 | (1.8)% | (10.0)% |
| U.S. 10-Year Treasury yield | 4.17% | 4.74% | 1.1% | 13.7% |
| Cdn. 10-Year Bond CGB yield | 3.44% | 3.67% | 1.7% | 7.7% |
| U.S. 2-year/10-year spread | 0.69% | 0.46% | 31.4% | (33.3)% |
| Cdn 2-year/10-year CGB spread | 0.85% | 0.75% | 7.1% | (11.8)% |
| US$ Index | 98.26 | 99.95 | (1.5)% | 1.7% |
| Canadian $ | 72.87 | 71.32 | 0.6% | (2.1)% |
| Euro | 117.48 | 115.29 | 1.4% | (1.9)% |
| Swiss Franc | 126.21 | 123.72 | 1.2% | (2.0)% |
| British Pound | 134.78 | 134.76 | 1.2% | (0.1)% |
| Japanese Yen | 63.83 | 62.92 | 3.1% | (1.4)% |
| Gold | 4,311.97 | 4,047.01 | (0.2)% | (6.1)% |
| Silver | 71.16 | 57.78 | (0.7)% | (17.8)% |
| Platinum | 2,046.90 | 1,660.00 | 3.8% | (18.9)% |
| Palladium | 1,619.50 | 1,280.00 | 2.9% | (21.0)% |
| Copper | 5.64 | 6.50 | 3.3% | 15.3% |
| WTI Oil | 57.44 | 84.63 | (6.0)% | 47.3% |
| Nat Gas | 3.71 | 2.70 | (6.3)% | (27.2)% |
Source: www.stockcharts.com
Stocks
The stock market has continued to hold despite a deteriorating backdrop. The NASDAQ briefly entered correction territory before recovering. The Semiconductor Index, at its recent low, was down 29%, placing it in bear market territory. The NY FANG Index fell 12% at its recent low. The MAG7 ETF (MAGS) declined 15% at its low but is now down 7% year to date. Among the MAG7 group, Tesla led the declines, down over 30%, followed by Microsoft and Meta.
Despite Middle East tensions, rising oil prices, and climbing bond yields, stock markets were generally higher for the week. The S&P 500 gained 1.1%, the Dow Jones Industrials (DJI) rose 1.0%, and the NASDAQ advanced 1.6%. The Dow Jones Transportations (DJT) fell 6.4%, hurt by rising fuel costs. The S&P 400 (Mid) declined 0.7%, while the S&P 600 (Small) gained 0.4%. The S&P 500 Equal Weight Index made new all-time highs, up 0.6%. Bitcoin fell 2%.
In Canada, the TSX touched all-time highs but closed down 0.4%. The TSX Venture Exchange (CDNX) slipped 0.2%. In Europe, London's FTSE rose 1.2%, EuroNext gained 0.2%, the Paris CAC 40 advanced 1.6%, and the German DAX climbed 2.1%. In Asia, China's Shanghai Index (SSEC) gained 0.5%, the Tokyo Nikkei Dow (TKN) fell 0.4%, Hong Kong's Hang Seng (HSI) jumped 3.7%, and India's Nifty 50 rose 2.6%. The MSCI World ex USA Index ETF gained 1.6%.
In Canada, eight of 14 TSX sub-indices fell, led by Utilities (TUT), down 2.7%. Information Technology (TTK) led the gainers, up 7.5%. Income Trusts (TCM) reached all-time highs before closing down 0.4%.
Wedge triangle patterns on both the S&P 500 and NASDAQ broke to the downside, but the indices rallied back—a weak breakdown with little follow-through. Nevertheless, the larger patterns suggest a topping formation. A break below 7,200 on the S&P 500 could trigger another leg down. The NASDAQ looks weak, with a further decline possible below 24,400.
A group of 10 stocks continues to dominate the market, meaning that index-level performance increasingly reflects a narrow set of mega-cap names rather than broad-based corporate health—a concentration risk worth monitoring as breadth deteriorates beneath the surface:
- Nvidia (NVDA) — Semiconductor and AI hardware leader
- Apple (AAPL) — Consumer electronics and digital services giant
- Microsoft (MSFT) — Cloud computing and enterprise software leader
- Amazon.com (AMZN) — E-commerce and AWS cloud infrastructure provider
- Alphabet (GOOGL/GOOG) — Search, digital advertising, and AI parent
- Broadcom (AVGO) — Semiconductor and networking infrastructure company
- Meta Platforms (META) — Social media and digital advertising company
- Tesla (TSLA) — Electric vehicle and clean energy manufacturer
- Berkshire Hathaway (BRK.B) — Diversified holding conglomerate
- Micron Technology (MU) or Oracle (ORCL) — Memory chips and enterprise data infrastructure
Bonds
Despite recurring attempts by Pakistan and others to restart Middle East peace talks, the probability of success remains low. Markets react positively to peace discussions—oil prices and bond yields fall, stocks and gold rally—before hostilities resume and the cycle reverses.
The U.S. 10-year Treasury note rose to 4.74%, up 5 basis points on the week. The Canadian 10-year Government Bond (CGB) yield climbed to 3.67%, up 6 basis points. The 2-year/10-year spread is widening: 46 bp in the U.S. and 75 bp in Canada. A widening 2–10 spread historically signals an approaching recession, as it reflects market expectations that short-term rate pressure will eventually ease in response to economic weakness.
The ongoing Middle East conflict is the primary catalyst for higher yields. Insatiable U.S. government borrowing demands, combined with massive capital needs for AI data centers, are creating conditions for sustained higher bond yields, which feed through to mortgages and other interest-rate-sensitive products.
The 30-year U.S. Treasury bond yield stands at 5.28%, the highest since 2004. Rising yields are not confined to the U.S.: German bunds, UK gilts, and Japanese JGBs are all climbing. The bond price decline (yields move inversely to prices) since the 2020 highs represents the worst bond market since the 1970s. Previous bond crashes have frequently exposed credit market vulnerabilities and triggered blow-ups.
Gold and Silver
Gold closed July higher by 0.7%. Silver fell 1.6%. The Gold Bugs Index (HUI) declined 4.1% and the TSX Gold Index (TGD) dropped 3.7%. On the week, gold was down 0.2%, silver fell 0.7%, the HUI lost 1.3%, and the TGD declined 1.8%. Platinum gained 3.8%, palladium rose 2.9%, and copper jumped 3.3%. Copper also rose 4.7% in July.
The U.S. Dollar Index fell 1.5% despite rising bond yields, which normally support the dollar. With USDX down, the Canadian dollar gained 0.6%, the euro rose 1.4%, the Swiss franc advanced 1.2%, the British pound increased 1.2%, and the Japanese yen surged 3.1% following massive BOJ intervention. Even the Chinese yuan, which is loosely pegged to the U.S. dollar, rose 0.3%. The U.S. Treasury apparently participated in the yen intervention alongside the BOJ.
A rising yen coupled with rising Japanese interest rates places considerable strain on the yen carry trade—borrowing yen to invest in higher-yielding assets elsewhere. An unwind of the carry trade could be highly disruptive, particularly for the U.S. bond market, as trillions in yen-funded positions would need to be unwound, potentially forcing rapid sales of dollar-denominated assets.
Gold has not made new lows despite the resumption of Gulf hostilities and surging oil prices. The $4,000 level appears to be key support. The pattern suggests gold may be attempting to form a small head-and-shoulders bottom, though this only holds if prices remain above $4,000. A break below could see a rapid decline to $3,400 or $3,600.
Silver likewise appears to be forming a head-and-shoulders bottom. A breakout above $60 would be constructive; a failure and break below $55 could target $50. A firm breakout above $70 would open the path toward $90.
Gold and silver typically react negatively to rising interest rates, yet both held their ground this past week despite climbing yields driven by higher oil prices and growing expectations of a September Fed hike. With the August/September seasonal period typically favorable for gold, the setup is improving.
For gold stocks, the TGD has support at 700, extending to 675. Below 675 would be problematic. A break above 850 would suggest a low is in place; above 1,000 would confirm a new uptrend.
Oil and Gas
Oil prices fell during the week following statements from Trump suggesting a ceasefire or deal was possible. By week's end, prices were rising again as new conflicts emerged and the war showed signs of widening.
The geopolitical landscape continues to deteriorate across multiple fronts:
-
Yemen/Houthis: Blockading Saudi oil shipments through the Strait of Bab el-Mandeb, the route connecting the Red Sea to the Gulf of Aden. Attacks on commercial and oil vessels are ongoing. Saudi Arabia is attempting to organize a Gulf state coalition to counter the Houthis.
-
Strait of Hormuz: Remains blocked by both Iran and the U.S., with little prospect of reopening.
-
Jordan: Iran attacked U.S. facilities in Jordan, causing damage and casualties. U.S. military bases in Jordan host American troops.
-
Iraq: Saudi Arabia and the U.S. launched attacks against Iran-aligned Shia militias in Iraq. Iraq denounced the strikes as a violation of sovereignty.
-
Egypt: Two ships, including a U.S.-owned gas storage vessel, caught fire at Damietta Port near the Suez Canal, reportedly due to a drone attack.
-
Caspian Sea: Ukraine attacked shipping in the Caspian Sea, striking a Russian missile boat and two Iranian cargo ships allegedly transporting arms between Russia and Iran.
-
Ukraine/Russia: Ukraine continues targeting Russian oil refineries. Offline refining capacity could eventually force oil production to be shut in.
-
China/Iran: China is reportedly sending approximately 400 air-defense launchers to Iran.
The conflict now involves the U.S., Israel, Iran, and Gulf states including Bahrain, Kuwait, Saudi Arabia, the UAE, and Qatar, as well as Oman, Dubai, Iraq, and Yemen. The Ukrainian strike in the Caspian Sea raises the potential for the war to spread into Europe. The Russia/Ukraine conflict already involves NATO and the EU supporting Ukraine, while China and North Korea support Russia, with North Korea sending troops. Israel remains in conflict with Palestinians in Gaza and the West Bank and with Hezbollah in Lebanon. Syria is likely involved as well.
The Middle East holds approximately 48%–51% of the world's oil supply and over 35% of global natural gas supply. Current disruptions in the Strait of Hormuz and the Red Sea/Bab el-Mandeb, with potential for further escalation, carry negative implications for oil, natural gas, fertilizers, petrochemicals, plastics, helium, aluminum, and other commodities, as well as shipping and logistics. With two of the world's most critical oil chokepoints simultaneously impaired, the global energy supply chain faces a level of disruption not seen in decades.
WTI oil fell 6% on the week while Brent crude dropped nearly 10%, though prices rebounded at week's end. Natural gas at the Henry Hub declined 6.3%, and the EU Dutch Hub fell 6%. However, the ARCA Oil & Gas Index (XOI) rose 1.5% and the TSX Energy Index (TEN) gained 0.9%—a divergence where stocks lead the commodity, which can be a positive signal.
WTI needs to break above $90, and especially above $105, to suggest targets of $140–$160. Natural gas could be forming a double bottom; a breakout above $3.40 could target $4–$4.50. U.S. commercial oil stocks remain near five-year lows and will require replenishing. There are no signs the Strait of Hormuz will open soon.
Glossary
- Daily (Short-term): Trend for swing traders
- Weekly (Intermediate): Trend for long-term trend followers
- Monthly (Long-term): Secular trend
- Up/Down: The trend direction
- Neutral: Indicators are mostly neutral; a trend change may be imminent
- Weak: The trend direction holds but is weakening
- Topping: Signs suggest the market is topping while the trend remains up
- Bottoming: Signs suggest the market is bottoming while the trend remains down
Disclaimer
David Chapman is not a registered advisory service and is not an exempt market dealer (EMD) nor a licensed financial advisor. He does not and cannot give individualized market advice. David Chapman has worked in the financial industry for over 40 years. The information in this newsletter is intended only for informational and educational purposes. It should not be construed as an offer, a solicitation of an offer, or sale of any security. Every effort is made to provide accurate and complete information. However, no guarantees are made regarding accuracy, completeness, or adequacy. The reader assumes all risk when trading in securities. David Chapman advises consulting a licensed professional financial advisor or portfolio manager before proceeding with any trade or idea. David Chapman may own shares in companies mentioned in this newsletter. Performance is not guaranteed, values change frequently, and past performance may not be repeated.
Source: SilverSeek

