XRP Breaks Below Rising Support as ETF Flows Stall
Key Takeaways
- •XRP closed below the rising support trendline of its consolidation pattern and remains beneath its 50-day moving average near $1.10.
- •The broken trendline, now positioned overhead in the $1.15 to $1.17 area, would need to be reclaimed for the structure to be repaired.
- •CryptoQuant data shows XRP exchange reserves diverging across venues, with Upbit at its lowest since May and Binance sitting 200 million XRP below its March peak.
- •Spot XRP ETF daily net inflows registered zero dollars for three straight sessions from July 22 through July 24 after recording inflows earlier in the month.
- •Continued weakness could bring the $1 psychological level into focus, and a close below it would mark XRP's first sub-dollar price since November 2024.
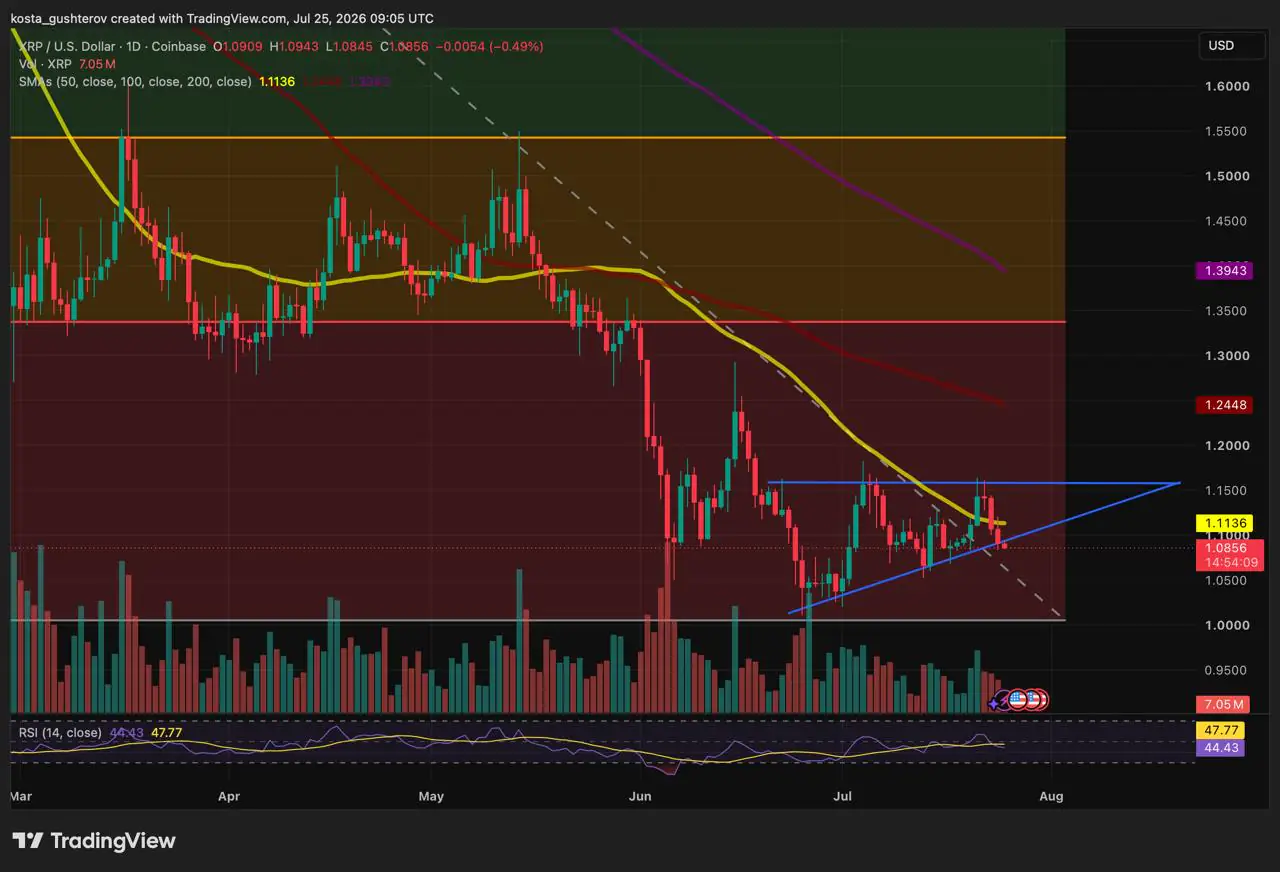
XRP closed the previous session below the rising support line of its recent consolidation pattern, a technical break that places the token roughly $0.10 beneath where that trendline currently projects. The move also comes while XRP is trading below its 50-day moving average near $1.10.
The breakdown follows a setup in which XRP had been compressing toward a $1.16 breakout trigger, with a rising support line and a flat upper boundary defining the range. That structure has now resolved to the downside rather than producing a bounce toward the apex, shifting attention from a potential continuation setup to whether former support can be recovered.
Break Below Support Changes the Short-Term Structure
Consolidation patterns typically reflect a contest between buyers and sellers. In this case, as long as XRP continued to hold the rising trendline, the chart preserved a sequence of higher lows. Closing below the lower boundary breaks that sequence and turns the former support area into potential overhead resistance.
The move is more than a marginal test of the trendline. With price now sitting well below the projected support level, the chart structure has shifted away from the prior consolidation setup. The token remains below its 50-day moving average, which is near $1.10, adding another technical hurdle for any attempted recovery.
Exchange Reserve Data Shows Divergence
Exchange reserve figures are also moving unevenly across venues. According to an analysis shared by CryptoQuant analyst Amr Taha, XRP reserves on Upbit have fallen to their lowest level since May, while Binance remains 200 million XRP below its March peak. Bithumb, meanwhile, has moved back close to its late-May level.
Reserve data is commonly watched because balances held on exchanges can affect available trading liquidity and may reflect how market participants are positioning coins across venues. Reserve declines do not, by themselves, establish whether tokens are being moved into self-custody, transferred between trading platforms, or redistributed elsewhere. However, the divergence across Upbit, Binance, and Bithumb remains a relevant data point when viewed alongside the weakening price structure.
Spot XRP ETF Flows Pause
Institutional demand through spot XRP ETFs has also gone quiet in recent sessions. Daily net inflows registered $0.00 for three consecutive sessions from July 22 through July 24, after inflows of $5.66 million on July 21 and $2.49 million on July 20.
The pause followed a stronger period earlier in July, when spot XRP ETFs recorded their largest single-day inflow of the month on July 16, according to SoSoValue. ETF flow data is a useful demand gauge because it tracks net creation and redemption activity through listed products rather than spot exchange trading alone. A halt in ETF inflows at the same time that XRP’s technical pattern has broken lower removes one potential offset to the recent price action, although the flow data alone does not confirm additional downside.
Levels Now in Focus
For XRP to repair the broken structure, it would need to reclaim the former rising trendline, now positioned overhead near the $1.15 to $1.17 area. A move back above that zone would reopen a retest of the pattern’s flat ceiling, with the 50-day moving average serving as an initial obstacle.
Without a reclaim of the broken trendline, any rebound would remain a relief move within an invalidated setup rather than a confirmed recovery. Continued weakness would bring the $1 psychological level into focus. That area also aligns with the measured-move target from the pattern. A close below $1 would mark XRP’s first sub-dollar print since November 2024.
Ascending triangles resolve upward more often than downward, making the clean downside break notable. The relative strength index is near 44 and remains below its signal line, indicating fading momentum rather than an oversold bounce setup. XRP also continues to trade below all three major moving averages, keeping the broader trend under pressure.
Disclaimer: This content is for informational purposes only and should not be treated as financial or investment advice. Markets are volatile, and past chart behavior does not guarantee future results. Make your own decisions and consult a professional before trading.
Methodology: Technical levels are sourced from the daily XRP/USD Coinbase chart via TradingView dated July 25, 2026. Exchange reserve figures come from a CryptoQuant report, and ETF flow data is from SoSoValue.

