Useless Coin Price Outlook 2026–2030: USELESS Tests Recovery Near Bollinger Band Support
Key Takeaways
- •USELESS traded at $0.0573, gaining 2.47% on the day after rebounding from an intraday low of $0.0558.
- •The token remains below the 20-day Bollinger Band average near $0.0709, indicating that the short-term trend is still under seller control.
- •Immediate support is around the lower Bollinger Band at $0.0455, where buyers recently appeared to defend the price.
- •The RSI has recovered to 39.13 but remains below the neutral 50 level, showing that momentum has improved without confirming a bullish reversal.
- •A sustained move above $0.0709 could improve the technical outlook and raise the possibility of a move toward $0.0963 and the $0.10 level.
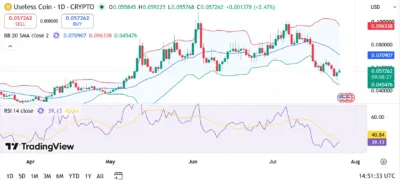
Useless Coin (USELESS) is attempting to stabilize after a sharp pullback pushed the token toward the lower Bollinger Band, though the broader short-term trend remains under bearish pressure.
TradingView data placed USELESS at $0.0573, up 2.47% on the day after rebounding from an intraday low of $0.0558. The move indicates buyers have stepped in near recent lows, but the token continues to trade below the 20-day Bollinger Band average, suggesting sellers still hold the short-term advantage.
Momentum indicators have also started to improve. The Relative Strength Index (RSI) has recovered to 39.13, while the RSI moving average stands at 40.84. Although the indicator remains below the neutral 50 level, its upward turn from weaker levels suggests selling momentum is easing. A stronger recovery would require continued buying pressure and confirmation above key resistance levels.
Technical readings such as Bollinger Bands and RSI are most useful as measures of recent price behavior rather than guarantees of future direction. For a volatile token such as USELESS, confirmation from price action around support and resistance levels remains important because short-term rebounds can occur even while a broader downtrend is still intact.
Market Structure and Price Action
USELESS posted a strong rally during May and early July, rising toward the upper Bollinger Band before heavy profit-taking reversed the move. Once the price fell below the Bollinger Band midline, bearish momentum accelerated, producing a series of lower highs and lower lows.
The decline eventually extended to the lower Bollinger Band near $0.0455, where buyers appeared to defend support. The latest rebound suggests demand has strengthened around that area, reducing the immediate risk of a breakdown while the wider downtrend remains in place.
For the market structure to shift more clearly in favor of buyers, USELESS would need to reclaim the Bollinger Band midline at approximately $0.0709. A move above that level could support additional buying and increase the probability of a push toward the upper Bollinger Band near $0.0963, bringing the psychological $0.10 level back into focus.
Technical Analysis
Current technical indicators continue to call for caution while showing early signs of improvement. The Bollinger Bands currently stand at:
- Upper Band: $0.09634
- Middle Band (20 SMA): $0.07091
- Lower Band: $0.04548
USELESS remains below the 20-day simple moving average, confirming that sellers continue to control the short-term trend. However, the rebound from the lower Bollinger Band suggests downside momentum may be losing strength.
A sustained move above $0.0709 would improve the technical outlook, while a breakout above $0.0963 could open the way for a test of the $0.10 psychological resistance. Conversely, a failure to hold above the lower Bollinger Band around $0.0455 could leave the token vulnerable to renewed selling pressure.
The RSI also reflects an attempt to recover. At 39.13, momentum remains below neutral but has turned upward after rebounding from weaker conditions. If the RSI moves above 50, it would offer stronger confirmation that buying momentum has returned.
Because USELESS is still trading below its 20-day simple moving average, traders monitoring the chart may look for whether any rebound is accompanied by sustained closes above the midline rather than a brief intraday move. A failure to do so would keep the current recovery attempt within the existing bearish structure.
Source: TradingView
USELESS Price Outlook for 2026–2030
Longer-term price outlooks depend on factors that extend beyond current chart structure, including broader cryptocurrency market conditions, liquidity, trading activity, and whether buyers can sustain demand over multiple cycles. The levels below should therefore be read as scenario-based technical milestones rather than assured outcomes.
2026
USELESS could consolidate above the $0.045 support zone while attempting to reclaim the Bollinger Band midline before targeting resistance near $0.095.
2027
Improving investor confidence and stronger trading activity could help the token build a more sustained advance toward $0.115.
2028
A broader cryptocurrency market recovery could support a breakout above $0.10, potentially opening the door to the $0.145 region.
2029
Continued ecosystem growth and improving liquidity may strengthen long-term price performance toward approximately $0.18.
2030
If bullish market conditions persist, USELESS could establish a stronger long-term uptrend and approach the $0.23 milestone.
Conclusion
USELESS has started to recover from the lower Bollinger Band, indicating that buyers are becoming more active after an extended correction. The token, however, remains below the 20-day Bollinger Band average, meaning the short-term trend has not yet turned decisively in favor of buyers.
The Bollinger Band midline near $0.0709 remains the key technical level to monitor. A recovery above that resistance would strengthen the outlook for a move toward $0.0963 and bring the psychological $0.10 target into focus. Until such a breakout occurs, price action is likely to remain volatile as buyers and sellers compete for control.
FAQs
-
What is the immediate support level for USELESS? The nearest support is around $0.0455, which aligns with the lower Bollinger Band.
-
What is the next major resistance for USELESS? The first important resistance is the Bollinger Band midline near $0.0709, followed by the upper Bollinger Band around $0.0963.
-
What does the RSI indicate for USELESS? The RSI reading of 39.13 suggests bearish momentum is weakening, although buyers have not yet confirmed a full trend reversal.
-
Can USELESS reach $0.10 by 2030? If the token reclaims key resistance levels and broader cryptocurrency market conditions remain favorable, reaching $0.10 is achievable before 2030.
-
Why is the Bollinger Band midline important? The Bollinger Band midline acts as a dynamic trend indicator. Reclaiming it often signals improving market sentiment and increasing buying momentum.

