Polkadot Price Prediction 2026-2032: DOT Forecasts, Technical Levels and Historical Trends
Key Takeaways
- •DOT is consolidating near $0.826, with $0.82 identified as short-term support and $0.837 as immediate resistance.
- •A sustained move above $0.84 could improve bullish momentum, while a drop below $0.80 would expose recent swing lows.
- •Polkadot referenda #1909 and #1910 propose staking changes including self-stake rewards, permissionless chilling and a shorter unbonding period.
- •The cited long-range forecast projects DOT reaching a maximum of $2.01 in 2026 and $18.44 in 2032.
- •Cryptopolitan’s separate forecast estimates DOT could trade between $0.70 and $1.31 in 2026 and reach up to $10.44 by 2032.
Polkadot (DOT), a blockchain network designed to connect and secure multiple blockchains, remains under pressure in July 2026 while analysts track whether the token can recover from recent lows. The latest long-range forecasts cited in the source project DOT reaching a maximum of $2.01 in 2026, ranging between $5.16 and $6.32 in 2029, and rising to a maximum of $18.44 in 2032.
Created by Ethereum co-founder Gavin Wood, Polkadot was built to address scalability, interoperability and security through a multi-chain architecture. Its central relay chain coordinates specialized blockchains known as parachains, allowing transactions to be processed in parallel. DOT, the network’s native token, is used for governance, staking to help secure the ecosystem, and bonding to add new parachains. Those roles make DOT’s outlook tied not only to market trading conditions, but also to network participation, validator incentives and the pace of parachain activity.
Polkadot technical analysis
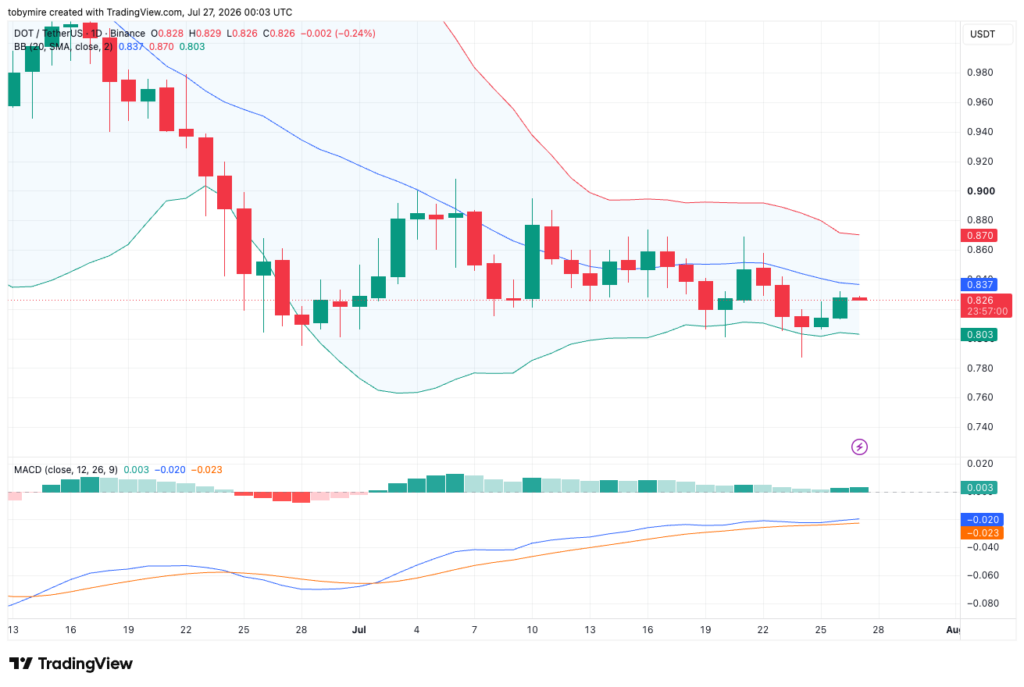
DOT is consolidating above $0.82 after stabilizing from its recent decline. The $0.82 area remains an important short-term support level, while $0.837 is identified as the immediate resistance. A move above $0.84 could restore bullish momentum, while a failure to hold support could bring another test of $0.80.
Daily price chart
On the daily chart, DOT is trading around $0.826 and remains below the Bollinger Band midline at $0.837, which continues to function as near-term resistance. The price is holding above the lower Bollinger Band at $0.803, indicating that buyers are still defending the recent support zone.
The MACD remains positive, with the MACD line above the signal line. However, the histogram is flattening, suggesting that bullish momentum is weakening. A daily close above $0.837 could open a path toward $0.87, while a move below $0.80 would expose recent swing lows.
Four-hour price chart
The four-hour chart shows a more balanced setup. DOT is trading near $0.826, while the Alligator moving averages are tightly clustered around $0.82-$0.823, reflecting consolidation after the recent recovery.
The RSI has risen to 53.75, moving above the neutral level and showing modest buying strength without reaching overbought territory. As long as DOT remains above $0.82, buyers hold a slight near-term advantage. A break above $0.83-$0.84 could strengthen bullish momentum, while a decline below $0.82 would likely shift control back to sellers.
Technical indicators and near-term outlook
DOT is moving within a narrow range as momentum gradually improves. Buyers are defending $0.82, but a sustained move above $0.84 is needed to confirm a stronger recovery. Until that happens, the source expects continued sideways trading with a slight bullish bias.
The article also notes cautious short-term price behavior, with DOT described as trading in a tight range between $1.25 and $1.30. It says this range-bound movement indicates market indecision and that long-term potential depends on Polkadot’s continued network development, adoption and broader crypto market conditions.
According to the long-term projections cited, Polkadot is expected to reach up to $10 by 2031. The source also states that DOT is projected to reach up to $15 by 2040. A move to $100 is described as highly ambitious and unlikely in the near term. The article says Polkadot’s long-term outlook is supported by ongoing buying demand and community support, while noting the risks of volatile market conditions. As with other crypto price forecasts, these figures are scenario-based estimates rather than guaranteed outcomes, and they depend on conditions that can change quickly.
Recent Polkadot referenda
Polkadot has opened referenda #1909 and #1910 to revise staking economics, tighten validator requirements and lower costs for nominators. The proposals introduce self-stake rewards and permissionless chilling for under-bonded validators. They also remove nominator slashing and reduce the unbonding period from about 28 days to roughly 48 hours. Because Polkadot governance is handled through on-chain referenda, such proposals are a direct mechanism for changing network parameters that affect validators, nominators and the cost of maintaining security.
The two staking updates referenda #1909 and #1910 are live now on Polkadot. Together, they enact staking parameter updates to strengthen network security while optimising overall security costs. Ref #1909 : Builds on the approved 10,000 DOT minimum self-stake requirement,… — Polkadot (@Polkadot) July 6, 2026
The two staking updates referenda #1909 and #1910 are live now on Polkadot. Together, they enact staking parameter updates to strengthen network security while optimising overall security costs. Ref #1909 : Builds on the approved 10,000 DOT minimum self-stake requirement,…
Polkadot price prediction for July 2026
For July 2026, Polkadot is expected to trade between $0.70 and $1.01, with an average price of about $0.86.
Polkadot price prediction for 2026
The DOT forecast for 2026 anticipates a minimum value of $0.92 and a maximum value of $2.01. The token’s average price is projected at around $1.53.
Polkadot price predictions for 2027-2032
2027 forecast
According to the Polkadot forecast for 2027, DOT could reach a maximum price of $3.01. The lowest expected price is $2.56, while the average forecast price is $2.63.
2028 forecast
Polkadot is projected to reach a minimum value of $3.65 in 2028. Based on the cited analysis, DOT could rise to a maximum of $4.51 and trade at an average price of $3.75.
2029 forecast
In 2029, DOT is expected to reach a minimum price of $5.16, a maximum price of $6.32 and an average trading price of $5.35.
2030 forecast
The Polkadot forecast for 2030 projects a minimum value of $7.50. The maximum value is listed at $8.93, while the average trading price is expected to be $7.77.
2031 forecast
For 2031, the DOT forecast calls for a maximum price of $13.13, a minimum price of $10.57 and an average forecast price of $10.96.
2032 forecast
In 2032, Polkadot is projected to reach a minimum level of $15.69. If positive market sentiment persists, the forecast says DOT could reach a maximum price of $18.44 and an average trading price of $16.24.
Cryptopolitan’s DOT forecast
Cryptopolitan’s own Polkadot (DOT) price prediction differs from the longer-range table cited in the article. For 2026, it expects DOT to trade between $0.7 and $1.31, with an average price near $1.01. It says continued network growth and adoption could support gradual gains. By 2032, Cryptopolitan projects DOT could reach up to $10.44. The gap between forecast sets highlights how long-range crypto projections can vary depending on assumptions about adoption, liquidity, network growth and broader market conditions.
Historical Polkadot price performance
After spending much of late 2020 around $4-$5, Polkadot broke above its previous $7 high on December 29 and quickly reached $10.
DOT recorded rapid gains in 2021, rising from around $3 in January to an all-time high near $57.50 in May. It then fell to about $10 in July before recovering above $40 in November.
In 2022, DOT entered a sharp decline, falling from around $30 at the start of the year to below $10 by mid-year. It later stabilized near $5 by the end of the year.
Through 2023 and early 2024, DOT mostly consolidated between $5 and $7 before briefly recovering toward $10.40 in December 2024.
In 2025, DOT weakened again. It fell from a January high of $7.98 to around $4.30 in March, then moved below $4 through April and May. By June, it declined toward $3.30, briefly stabilized near $4.00-$4.30 from August to October, and then dropped to around $2.10 by late November and early December.
In 2026, DOT remained under pressure. It traded between $1.66 and $2.33 in January, $1.15 and $1.74 in February, $1.23 and $1.65 in March, and $1.22 to $1.27 in April. In May, DOT averaged approximately $1.24, based on CoinGecko historical data.
In June, DOT extended its decline, trading between roughly $0.89 and $1.19. In July, it has remained under pressure, trading around $0.84-$0.93 so far, with the current price near $0.84.

