MarketWise Reports Q2 2026 Billings of $91.2 Million, Up 57% Year-Over-Year, Raises FY 2026 Guidance to $330 Million
Key Takeaways
- •MarketWise posted its strongest quarterly billings since 2023 at $91.2 million, representing a 57% year-over-year increase driven by higher customer acquisition and improved retention.
- •The company raised its full-year 2026 billings target by 10% to $330 million, reflecting an expected growth rate of approximately 21.7% over fiscal year 2025.
- •Paid subscribers grew to 400,000 as of June 30, 2026, a 4.8% sequential increase, supported by aggressive marketing of higher-priced products during the first half of the year.
- •A $12.2 million legal settlement disbursement in April 2026 resulted in the repurchase of 3% of total shares outstanding and concluded associated litigation and Tax Receivable Agreement obligations.
- •Although GAAP net revenue declined 5.2% year-over-year due to multi-year deferred revenue recognition, the company expects net revenue to stabilize in 2026 and return to growth in 2027.
BALTIMORE, Aug. 06, 2026 (GLOBE NEWSWIRE) — MarketWise, Inc. (NASDAQ: MKTW) ("MarketWise" or the "Company"), a multi-brand digital subscription services platform offering premium financial research, software, education, and tools for self-directed investors, reported its financial results for the second quarter of 2026. MarketWise is one of the larger publicly traded companies in the financial research and publishing sector, a niche that has grown alongside sustained retail investor participation in U.S. equity and options markets. All quarterly results referenced are unaudited.
Second Quarter 2026 Highlights
- Billings totaled $91.2 million, a 57% year-over-year increase from the second quarter of 2025 and the highest quarterly figure since 2023.
- Cash from Operating Activities (CFFO) reached $22.4 million, up $4.6 million or 25.7% compared to the same period in 2025, driven primarily by higher Billings and working capital movements.
- Total Net Revenue was $75.8 million. Net Revenue, a GAAP measure, reflects Billings recognized over the subscription term, which can span multiple years. Billings represent amounts invoiced to customers during the period and are indicative of the current operating environment and demand.
- Net Loss of $2.6 million was recorded, primarily due to the timing difference in deferred revenue recognition and increased sales and marketing expenditure.
- Cash and cash equivalents stood at $33 million as of June 30, 2026, which included the $12.2 million cash disbursement in April 2026 related to the previously disclosed legal settlement and the associated repurchase of 3% of total shares outstanding.
- Paid Subscribers reached 400 thousand as of June 30, 2026, compared to 381 thousand as of March 31, 2026. Active Free Subscribers totaled 2.1 million.
- FY 2026 Billings guidance was raised by 10% to $330.0 million, representing 21.7% full-year growth compared to FY 2025.
- Dividends of $0.45 per share were paid to Class A Shareholders during the quarter. The full-year dividend target of $1.80 per share remains unchanged.
CEO Commentary
"As we shared in mid-July, the operational momentum from the first quarter continued into the second quarter as Billings topped $91 million on the back of higher customer acquisition, improved customer retention, and strong conversion of our higher priced products," said Dr. David Eifrig, Chief Executive Officer. "Our strategy is simple. Acquire the right customers with compelling products and ideas, earn trust as we educate and empower, and then deepen our relationship with our customers over time."
Eifrig continued: "For the first quarter, and continuing into the second quarter, we meaningfully increased investment in customer acquisition. This opportunistic marketing investment resulted in a strong increase in Paid Subscribers during the first and second quarters. Consistent with our plans, we now moderate customer acquisition and shift toward disciplined cash generation for the balance of the year. This is the strategic core of our business model, where we toggle between growth and margin, on a near real-time basis, in response to market conditions and opportunity. As such, while margins were lower in the first half of 2026 due to an increase in investment in customer acquisition, we expect margins to increase significantly in the second half of the year."
"Regarding our financial guidance, given the robust growth in the first half of 2026, we are increasing our FY 2026 Billings Target by 10% to $330 million, which represents a 21.7% increase compared to FY 2025."
"Finally, we recently completed a review of our long-term strategic plan with our Board of Directors. I am more excited than ever about our plans to provide high-quality products for our customers while delivering strong top-line growth coupled with margin expansion over time. The plan also forges the alignment of incentives as we execute our business strategy. Achieving our ambitious plans will require discipline, innovation, and operational creativity. We have fantastic brands, fantastic teams, and a strategy designed to enhance value for subscribers and shareholders."
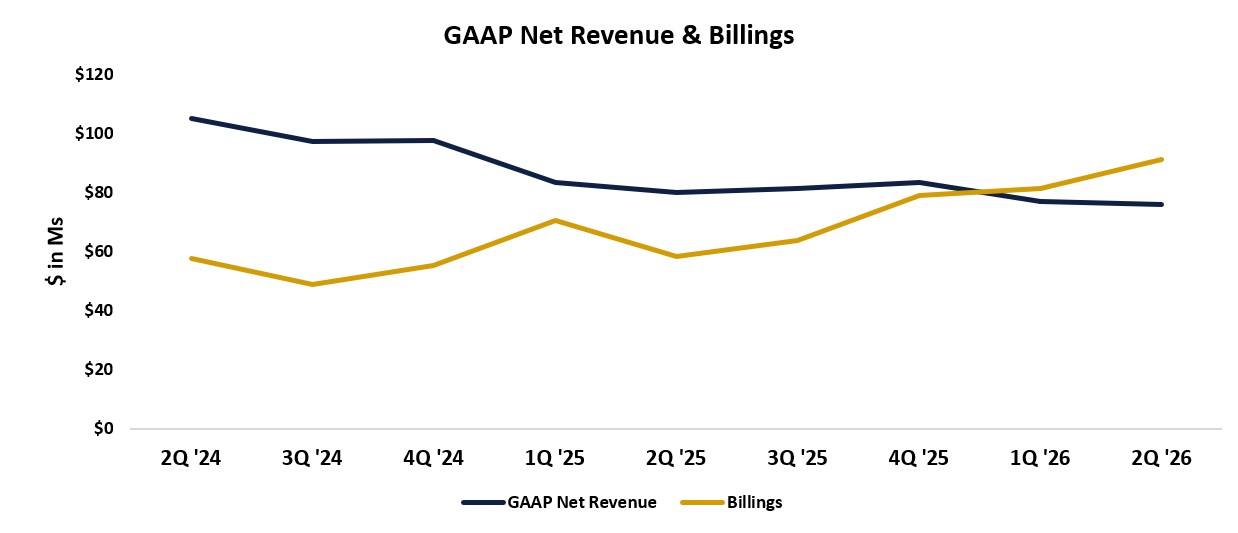
GAAP Net Revenue versus Billings
GAAP Net Revenue represents cash received by the Company for subscription sales, which is recognized as revenue for GAAP purposes over the subscription term of up to 5 years. Cash received is recorded as Deferred Revenue on the Balance Sheet until recognized as GAAP Net Revenue.
Given the deferred nature of revenue recognition, there can be a significant lag between when cash is received and when revenue appears in the Income Statement. For example, Net Revenue recognized in Q2 2026 included substantial cash sales from 2021 and 2022. Consequently, GAAP Net Revenue may not accurately reflect the Company's current trajectory.
In contrast, Billings represent current-period cash sales and are reflective of real-time operating activity. This disconnect is visible in 2026 results: GAAP Net Revenue declined 5.2% from Q2 2025 to Q2 2026, while Billings increased 56.7%. The Company expects a similar dynamic through FY 2026, with GAAP Net Revenue declining as customer sales activity and Billings increase. Billings typically lead Net Revenue by 12–24 months on average; the Company expects Net Revenue to stabilize in 2026 and return to growth in 2027.
Paid Subscribers
Paid Subscribers at June 30, 2026 were 400 thousand, an increase of 19 thousand or 4.8% from 381 thousand at March 31, 2026. The increase resulted from compelling products and content combined with significant investment in direct marketing during the first half of 2026. For the second half of 2026, the Company plans to scale back marketing investment and focus on monetization of existing subscribers, which could result in modest Paid Subscriber declines as it strategically balances growth and margin.
Subscriber Composition Trends
As of June 30, 2026, the Company had 2.1 million Active Free Subscribers. Part of the Company's acquisition strategy is to convert these free subscribers to Paid Subscribers. The Company's 400 thousand Paid Subscribers represented a 4.8% sequential increase.
Since mid-2024, the Company has pivoted its strategy toward higher-priced products. While Paid Subscribers have declined over the past two years in absolute terms — with modest sequential improvement in the two most recent quarters — subscriber quality and lifetime spend have increased. This approach — trading volume for value — reflects a broader trend among subscription-based businesses that have shifted focus from raw user counts toward customer lifetime value and revenue per user as key performance indicators.
As of June 30, 2026, 61% of customers had a lifetime spend exceeding $500. The majority of customer churn originates from lower-value tiers, as those cohorts continue to decline as a percentage of the total. However, the $500-or-less cohort increased in Q2 2026 due to successful customer acquisition efforts. As these new customers purchase additional products, the Company expects lifetime spend for this cohort to rise. This positive mix shift and improvement in customer quality have contributed to Billings and ARPU growth over recent quarters.
Billings
Following a period of Billings declines from 2021 through mid-2024, the Company reached an inflection point in Q4 2024 with a return to sequential growth. Billings have continued a steady increase, with Q2 2026 rising 57% year-over-year and 12% sequentially to approximately $91.2 million — the highest total since 2023. The increase resulted from marketing efforts that yielded a significant cohort of new subscribers combined with strong revenue retention from existing subscribers. The sustained sequential growth over the past six quarters marks the company's most pronounced operational recovery since the post-2021 downturn.
Cash Flow from Operating Activities
CFFO was $22.4 million for the three months ended June 30, 2026, an increase of $4.6 million compared to Q2 2025. For the six months ended June 30, 2026, CFFO was $20.3 million, compared to $19.6 million for the same period in FY 2025.
CFFO fluctuates from quarter to quarter based on the Company's business model. Q2 and Q4 tend to produce higher CFFO, while Q1 and Q3 tend to be lower. Quarterly CFFO is impacted by the timing of product launches, marketing campaigns, and discrete working capital items. The Company recommends evaluating CFFO trends over multiple quarters or a full year.
Balance Sheet and Capital Structure
As of June 30, 2026, the Company held cash and cash equivalents of $33 million, down from $53 million at March 31, 2026. The decrease was primarily due to a $12.2 million cash disbursement in April 2026 related to the previously disclosed legal settlement, including termination of related rights under the Company's Tax Receivable Agreement and resolution of associated litigation claims. The disbursement also resulted in the repurchase of 3% of total shares outstanding, reducing the share count and concluding a matter the Company had flagged in prior disclosures.
The Company had previously expected FY 2026 tax distributions to decline to approximately $35.0 million — nearly $14.8 million below FY 2025. However, due to continued improvement in business performance, full-year 2026 tax distributions are now expected to be approximately $40.0 million. Consistent with FY 2025 timing, FY 2026 distributions will be weighted toward the first half of the year. The Company expects overall cash balances to increase during the second half of 2026 due to the timing of tax distribution payments and higher expected margins.
MarketWise Inc.'s Class A common stock trades on the Nasdaq Global Market under the symbol "MKTW." As of June 30, 2026, the Company had 2,666,908 Class A common shares and 12,986,774 Class B common shares issued and outstanding, totaling 15,653,682 shares. The Company considers it appropriate to include both Class A and Class B shares when determining market capitalization or equity value. Net Income attributable to noncontrolling interests on the Condensed Consolidated Statements of Operations is primarily associated with Class B shares and results from the Company's corporate structure.
FY 2026 Targets
The Company's strategic plans and initiatives center on delivering high-quality investing ideas and tools to customers. For FY 2026, targets are as follows:
- Billings of approximately $330 million, representing growth of approximately 21.7% from FY 2025.
- CFFO of approximately $50 million, a nearly 10% year-over-year increase compared to FY 2025.
- Total dividends of $1.80 per share of MarketWise, Inc. Class A common stock.
These forward-looking targets are based on current trends and market conditions; actual results may differ materially. Dividend amounts are subject to ongoing approval by the Board of Directors.
About MarketWise
Founded with a mission to level the playing field for self-directed investors, MarketWise is a multi-brand subscription services platform providing premium financial research, software, education, and tools. With more than 25 years of operating history, MarketWise serves millions of free and paid subscribers. The Company is 100% digital and direct-to-customer, offering research across mobile, desktop, and tablet platforms.
Key Business Metrics and Non-GAAP Financial Measures
The Company discusses certain key business metrics it believes provide useful operational context:
- Billings is defined as amounts invoiced to customers.
- Paid Subscribers is the total number of unique subscribers with at least one paid subscription at the end of the period.
- Active Free Subscribers are unique subscribers who have subscribed to a free investment publication via a valid email address and who received and/or consumed content during the quarter, excluding Paid Subscribers who also have free subscriptions.
- Average Revenue per User (ARPU) is defined as trailing four quarters of net Billings divided by the average number of quarterly total Paid Subscribers over that period.
Non-GAAP financial measures used by the Company include:
- Adjusted CFFO: CFFO plus or minus any non-recurring items.
- Adjusted CFFO Margin: Adjusted CFFO as a percentage of Billings.
- Free Cash Flow: Net cash provided by (used in) operating activities less capital expenditures, defined as purchases of property and equipment plus capitalized software development costs. Acquisitions are not included.
These non-GAAP measures are presented for supplemental informational purposes and should not be considered substitutes for GAAP financial information.
Cautionary Statement Regarding Forward-Looking Statements
This press release contains forward-looking statements within the meaning of the Private Securities Litigation Reform Act of 1995, including statements regarding the Company's financial position, business strategy, and plans. Forward-looking statements are identified by words such as "believe," "project," "expect," "anticipate," "estimate," "intend," "strategy," "future," "opportunity," "plan," "may," "should," "will," "would," "target," and similar expressions.
These statements are based on current expectations and assumptions and are subject to risks and uncertainties, including but not limited to: the Company's ability to attract and retain subscribers, market and develop products, manage growth, maintain its reputation, attract and retain personnel, navigate macroeconomic conditions including inflation and interest rate changes, comply with regulations, adapt to technology changes, and integrate acquisitions. Additional risks are described in the "Risk Factors" section of the Company's filings with the U.S. Securities and Exchange Commission (the "SEC"). Forward-looking statements speak only as of the date they are made, and the Company assumes no obligation to update them.
Financial Tables
- Table 1. Income Statement — Cost of revenue, sales and marketing, general and administrative, and research and development expenses are exclusive of depreciation and amortization shown as a separate line item.
- Table 2. Balance Sheet
- Table 3. Cash Flows
Contacts
MarketWise Investor Relations
Erik Mickels – Chief Operating and Financial Officer
Email: ir@marketwise.com
MarketWise Media Contact
Email: media@marketwise.com
Source: GlobeNewswire
