Chainlink (LINK) Breaks Below $8.38 Support; Analyst Crypto Patel Flags Bearish Trend Shift
Key Takeaways
- •Chainlink's LINK token fell below the $8.38 support level, breaking a rising trendline that had guided recent price action.
- •Crypto analyst Crypto Patel shared a short trading setup with an entry range of $8.38 to $8.48 and downside targets at $7.87, $7.67, and $7.40.
- •LINK is trading around $8.31, sitting below both its 50-day moving average near $8.75 and its 200-day moving average near $9.30, confirming bearish short- and long-term trend signals.
- •The breakdown occurred on above-average daily volume of approximately $150 million, which typically reinforces seller conviction.
- •A Fibonacci retracement level near $7.67 aligns with one of Patel's downside targets, potentially making that zone a significant price level for traders.
- •Chainlink's all-time high of $52.88 was set in May 2021, while analyst price predictions for 2030 range from as low as $10 to over $230.
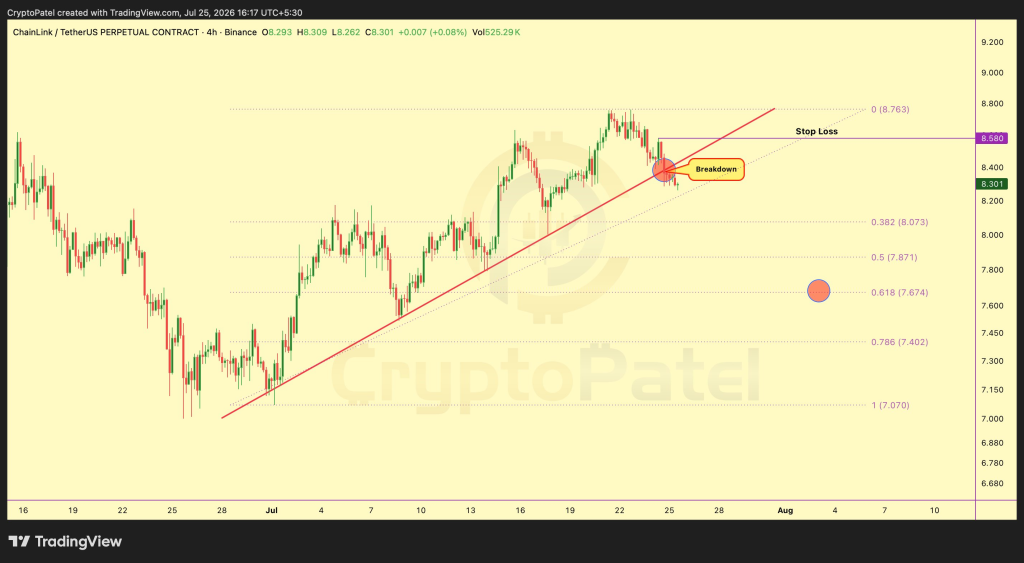
Chainlink (LINK) traders received an unambiguous signal this week after the token slipped below a support level that had held firm for several weeks. The breakdown carried enough momentum to alter how multiple analysts interpret the LINK chart, with market structure now appearing to tilt in favor of sellers.
Among the first to flag the move was crypto analyst Crypto Patel, who posted a detailed breakdown of the LINK chart. His assessment was straightforward: LINK lost the $8.38 support level, confirming a break below the rising trendline that had been guiding price action over the preceding period.
According to Patel, the breakdown weakens the broader bullish structure LINK had established in recent weeks. He characterized the development as a shift toward sellers, noting that price is likely to remain under pressure as long as it stays below the level it just surrendered.
Patel outlined a short trading setup for those tracking LINK closely, specifying an entry zone between $8.38 and $8.48 with three downside targets and a defined stop loss:
- Entry range: $8.38 to $8.48
- Targets: $7.87, then $7.67, then $7.40
- Stop loss: $8.58
Patel concluded his post by stating that the trend has changed and that traders should watch for confirmation rather than anticipate a reversal. He included a standard disclaimer noting that his analysis does not constitute financial advice and urged followers to conduct their own research.
Technical Indicators Show Mixed but Tilting-Bearish Picture
A review of the LINK daily chart reveals a market that has not decisively committed to a direction. Several indicators point toward weakness, while a few still leave room for a bullish case. This divergence carries significance, as the next confirmed move could carry substantial weight in either direction.
The Relative Strength Index (RSI) on the daily chart currently sits near 44, placing LINK in neutral territory with a slight lean toward weakness. The reading has not yet reached oversold levels, leaving room for further downside before a bounce becomes probable.
The Moving Average Convergence Divergence (MACD) line is trading just below its signal line, with the histogram printing a small negative value near the zero line. This configuration typically signals mild selling pressure beneath the surface, even when price has not yet moved dramatically.
LINK is currently trading around $8.31, a level that sits below both the 50-day moving average near $8.75 and the 200-day moving average near $9.30. This alignment confirms a shorter-term downtrend and keeps both medium- and longer-term trend readings pointed in a bearish direction.
Daily trading volume came in near $150 million, above the recent average during the session in which the $8.38 support gave way. Breakdowns on light volume can often reverse quickly, but heavier volume behind a drop tends to reinforce seller conviction.
Fibonacci retracement levels drawn from the last major swing place the $7.67 zone near a key retracement point — a level that aligns almost exactly with one of the downside targets cited by Crypto Patel. Overlapping signals from separate technical tools can make a price level more significant for traders seeking confirmation.
Chainlink operates as a decentralized oracle network that supplies real-world data to smart contracts across dozens of blockchains, making LINK a widely held infrastructure token within the crypto ecosystem. Because oracles sit at the foundation of DeFi lending, derivatives, and insurance markets, sharp moves in LINK often draw attention beyond its own trading community. A sustained breakdown could prompt traders to watch whether other mid-cap infrastructure tokens follow a similar pattern, since correlated moves across the sector have occurred during prior risk-off episodes.
Chainlink has broken through support levels in the past, only to recover when buyers re-entered with renewed conviction. The coming sessions should reveal whether this breakdown follows that familiar pattern or develops into a more sustained move.
Historical Context and Long-Term Outlook
Chainlink's all-time high of $52.88 was recorded in May 2021. Analyst price predictions for LINK in 2030 vary widely, ranging from conservative estimates of $10 to $19, to mid-tier bullish forecasts of $45 to $110, and aggressive long-term targets exceeding $230.

