Bitcoin Short-Term Holder Losses Deepen Near $64K as Key Support Levels Come Into Focus
Key Takeaways
- •Bitcoin short-term holder market capitalization fell to $236.2 billion, near its lowest level since mid-2024.
- •Negative net realized profit and loss showed that recent buyers were selling coins below their acquisition prices.
- •Analysts identified $63,800 and $62,400 as the key support zone for Bitcoin’s next market test.
- •A break below both support levels would expose the charted downside target near $60,000.
- •Glassnode data showed one-week 25-delta skew near 4%, while three-month and six-month skews remained between 11% and 12%.
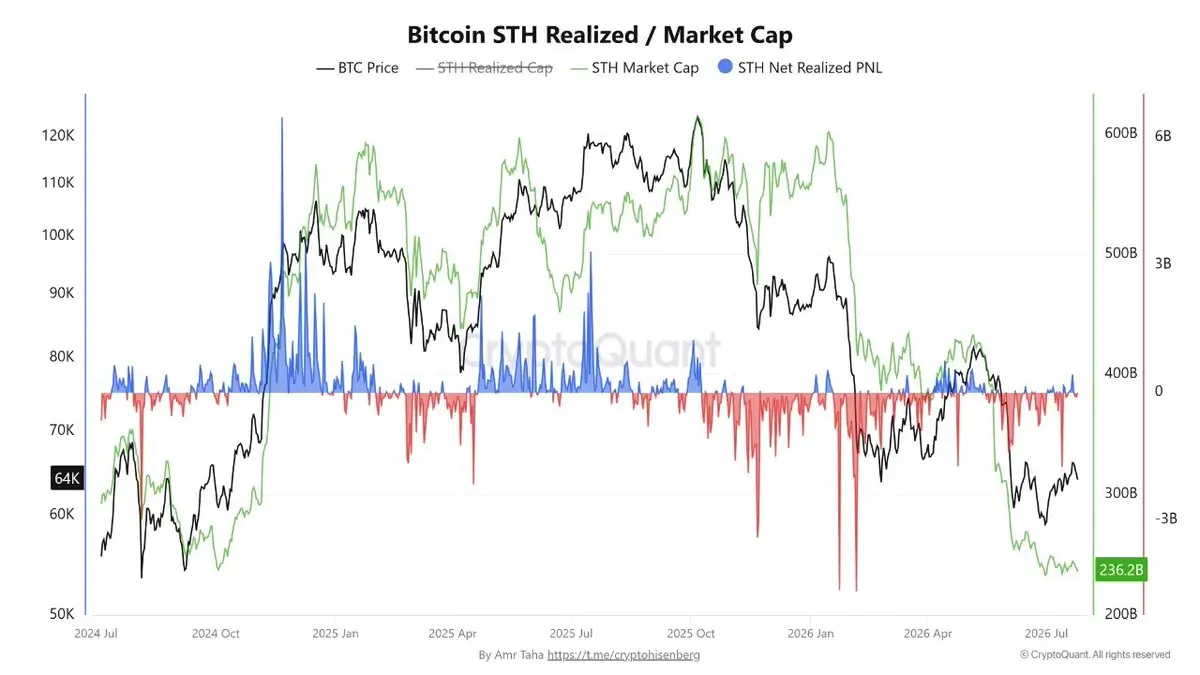
Bitcoin’s decline toward $64,000 has increased realized losses among recent buyers and put several closely watched technical support levels under pressure. On-chain data cited by Crypto Patel from CryptoQuant showed Bitcoin short-term holder market capitalization falling to $236.2 billion, near its lowest level since mid-2024.
Crypto Patel said the metric had dropped below an important 2024 benchmark for only the second time in the displayed period. At the same time, net realized profit and loss stayed negative, indicating that recent buyers were increasingly selling below their acquisition prices during Bitcoin’s 2026 market decline.
Short-Term Holder Capitalization Falls to $236.2 Billion
The CryptoQuant chart showed several deep red spikes during the 2026 downturn, pointing to repeated waves of realized losses among short-term holders. Those readings became more pronounced as Bitcoin moved further away from previous highs and approached the $64,000 area.
Short-term holder data is closely watched because it tracks coins held by investors with relatively recent entry points, a group that is often more sensitive to price drawdowns than long-term holders. Realized profit and loss measures coins when they move on-chain, so negative readings show that coins are being spent at prices below their prior acquisition levels.
The combination of falling short-term holder value and expanding realized losses indicates that weaker market participants continued to exit positions during the decline. However, the data does not identify the buyers receiving those coins, nor does it prove that selling pressure has ended.
The move down to $236.2 billion also places short-term holder capitalization near a level last seen around mid-2024. The decline reflects a smaller market value for coins held by investors with relatively recent entry points.
As losses mounted, chart support became a central focus for traders. Ali Charts identified $63,800 as the immediate decision level on Bitcoin’s four-hour chart. His analysis placed $67,000 as the recovery objective if that level continues to hold as support.
Keep an eye on Bitcoin $BTC at $63,800.
If this level holds as support, I'm watching for a rebound toward $67,000. But if it breaks, the next downside target sits around $60,000. pic.twitter.com/kAn0hDIEmc
— Ali Charts (@alicharts) July 25, 2026
https://x.com/alicharts/status/2080933271878201745?ref_src=twsrc%5Etfw
The same chart identified approximately $60,000 as the next downside target if Bitcoin confirms a break below $63,800.
Bitcoin’s $63,800-$62,400 Zone Defines the Next Test
Titan’s Ichimoku analysis also pointed to technical pressure. According to the analyst’s chart, BTC closed below the daily Tenkan line, shifting attention to the Kijun near $62,400. That level sits below the immediate horizontal support highlighted by Ali Charts.
#Bitcoin
BTC lost its Tenkan on the daily close.
Next logical target: Kijun around $62,400, and possibly the lower Kumo boundary if momentum continues.
As flagged in my previous post, price entering the Kumo brings higher volatility ahead, pic.twitter.com/uv8nhztjSt
— Titan (@Washigorira) July 25, 2026
https://x.com/Washigorira/status/2080944970522091977?ref_src=twsrc%5Etfw
Together, the two analyses define a narrow support zone between $63,800 and $62,400. A move beneath both levels would leave $60,000 as the next charted downside target.
Titan’s Ichimoku chart also showed BTC moving closer to the Kumo cloud. In Ichimoku analysis, the Tenkan and Kijun are commonly used as shorter- and medium-term trend references, while the Kumo cloud is watched as a broader support or resistance area. The analyst said that deeper movement into the cloud could bring higher volatility, while the lower Kumo boundary remained technically relevant.
Options data gave a separate but still defensive signal. Glassnode reported that Bitcoin’s one-week 25-delta skew had fallen near 4%, while three-month and six-month skews remained between 11% and 12%.
https://x.com/glassnode/status/2080623992742768747?s=20
That gap shows that immediate downside hedging had eased, while longer-dated protection continued to command a higher premium. In options markets, 25-delta skew is used to compare the pricing of downside puts and upside calls, making it a gauge of how traders are paying for protection across different maturities. Traders therefore reduced near-term downside positioning without abandoning protection against risks later in the year.
Bitcoin is now positioned between confirmed short-term holder losses and clearly defined technical support. The market’s next measurable test rests at $63,800 and $62,400. Holding those levels would preserve the existing chart structure, while losing them would expose the charted $60,000 target.

