Bitcoin Trades Near $65,000 as MVRV Z-Score Remains Below Historical Average
Key Takeaways
- •Bitcoin’s MVRV Z-Score is near 0.42, below its long-term average of 1.7 but still above negative territory.
- •The metric reached about 0.185 on June 30, marking the lowest level of the current cycle before rebounding.
- •Bitcoin has recently traded between $64,000 and $66,000 after falling about 15% over three months.
- •CryptoQuant data shows realized profit and loss turned positive over the past week, with the latest reading near $239 million.
- •Past Bitcoin cycle lows often followed negative MVRV Z-Score readings, which have not appeared in the current market setup.
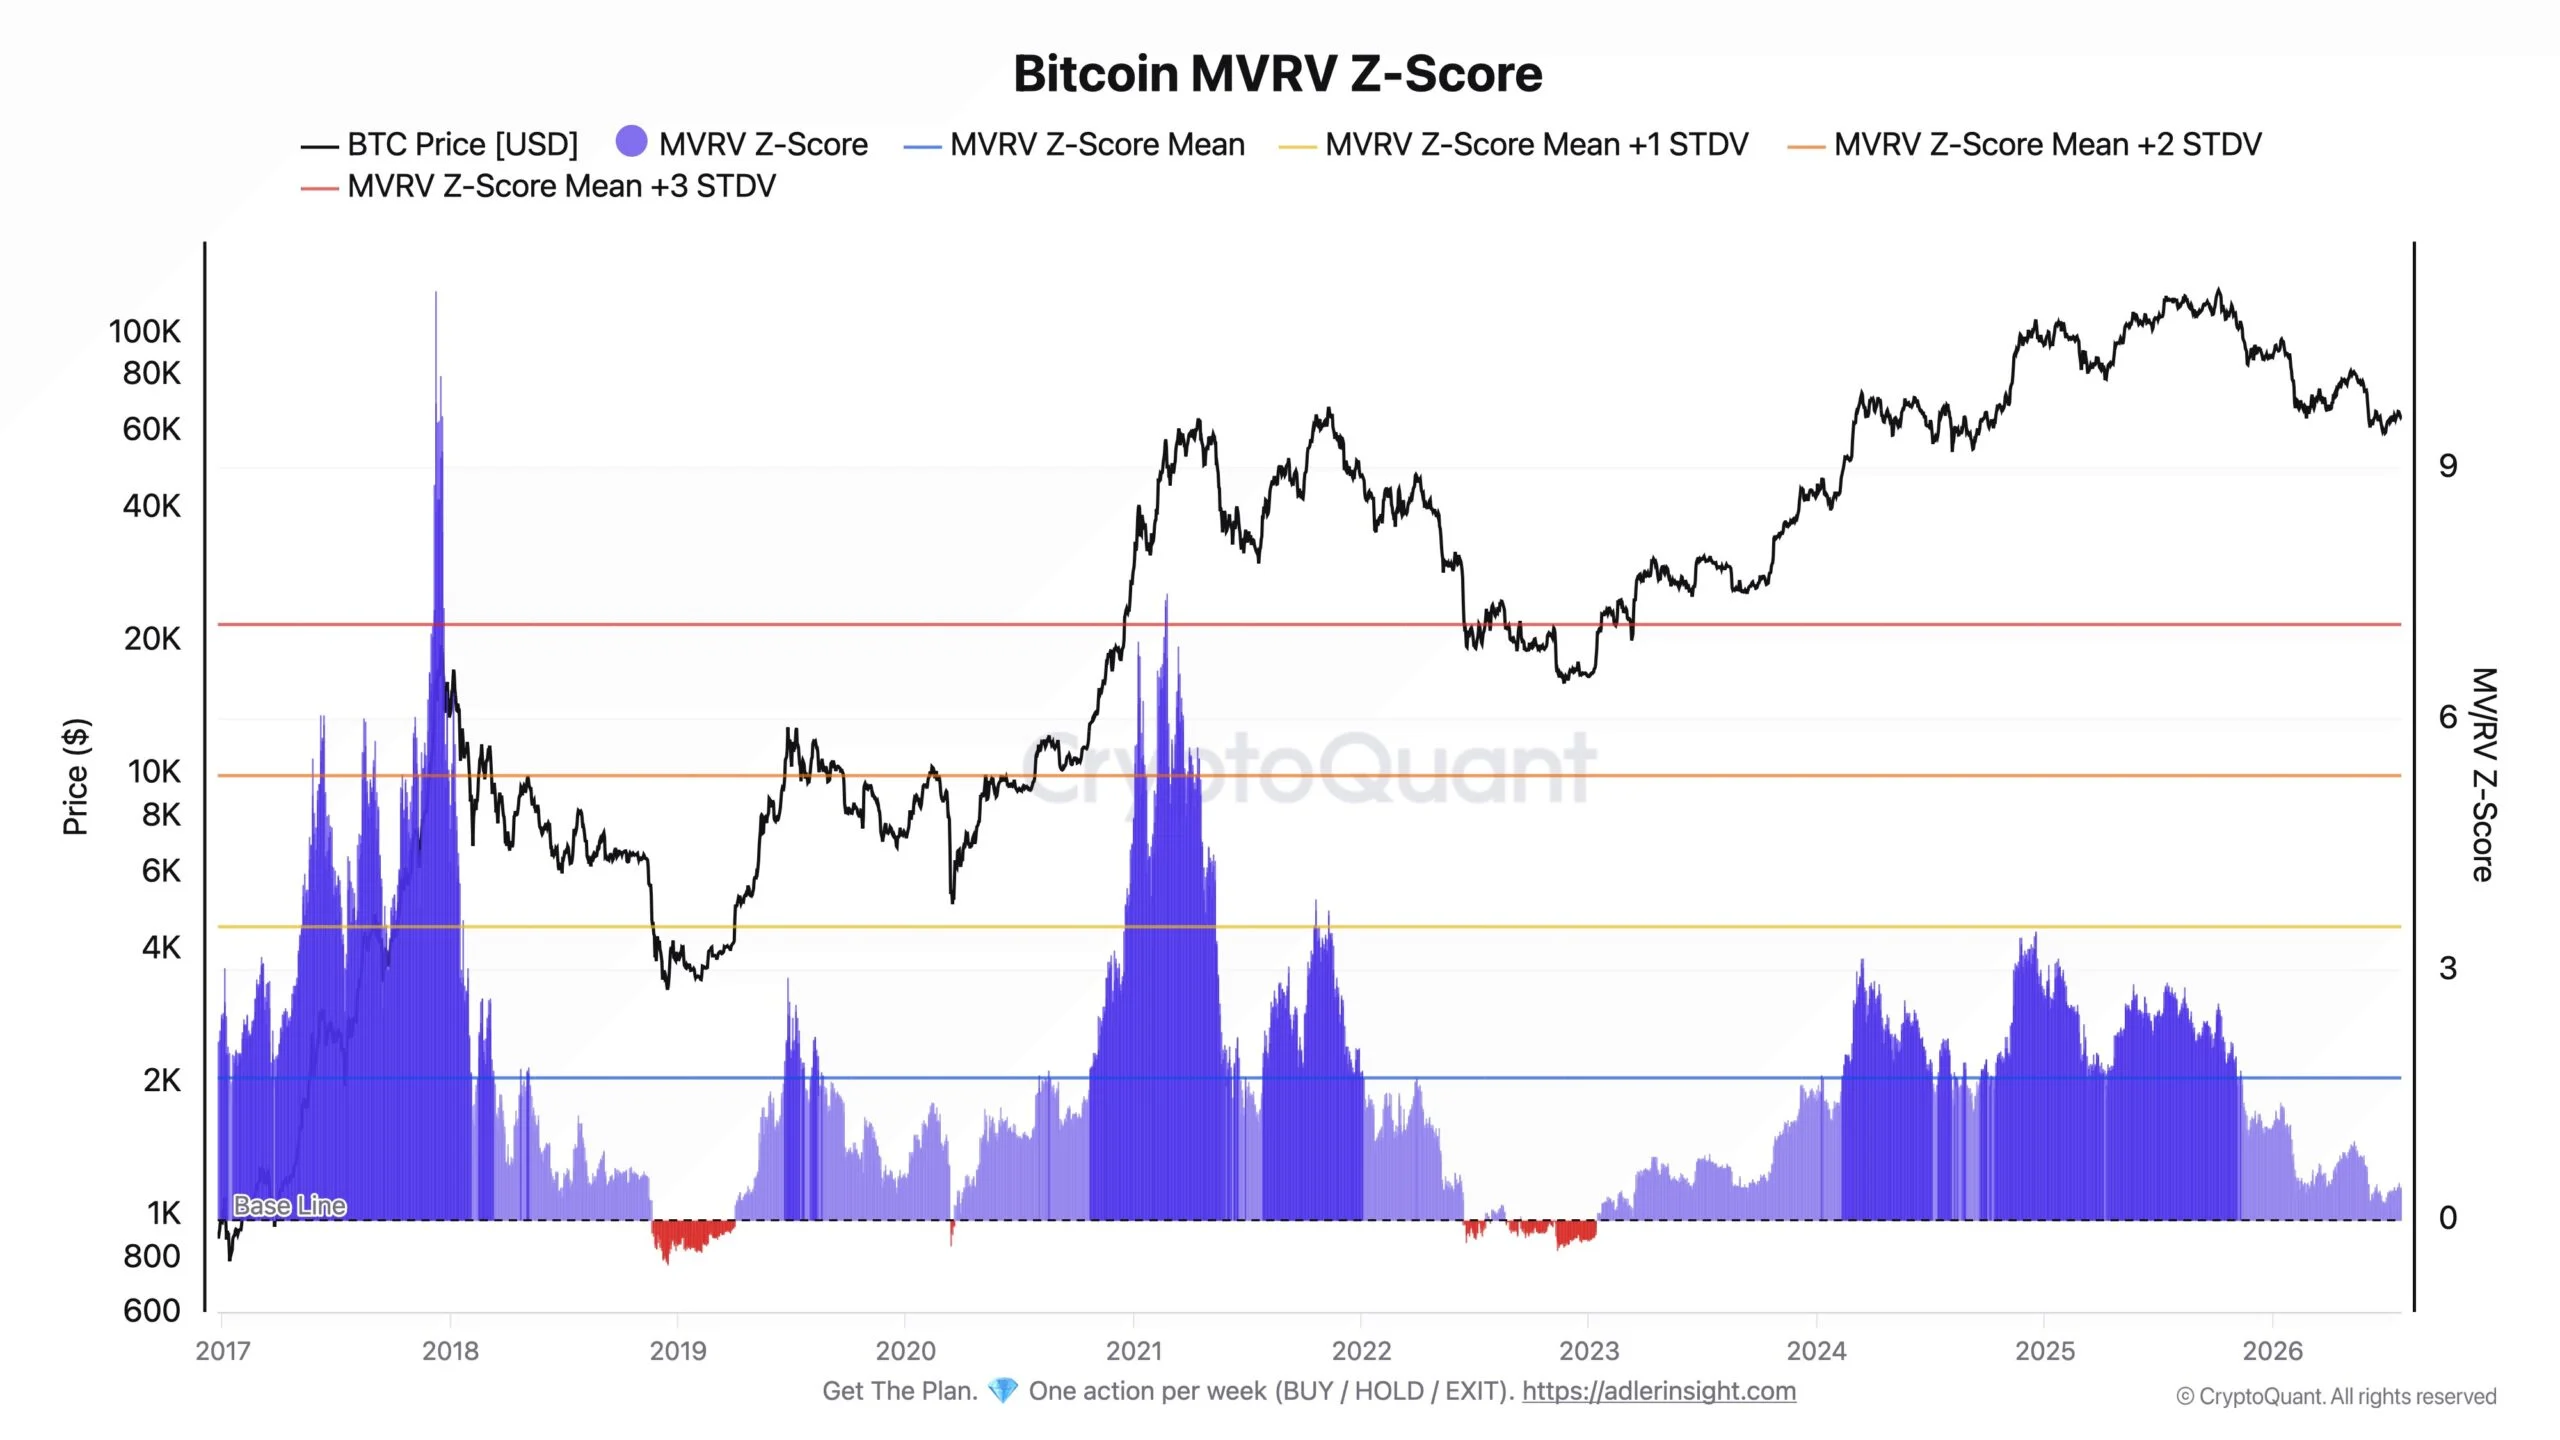
Bitcoin is trading near $65,000 while a key valuation measure remains well below its historical range. The latest MVRV Z-Score is near 0.42, compared with its long-term average of 1.7, keeping Bitcoin’s valuation in focus for market participants.
The reading indicates that BTC is trading below its usual valuation level, though it has not fallen to the extreme levels that have often appeared near major cycle lows. Bitcoin has also not entered negative MVRV territory, a condition that marked past capitulation phases.
Bitcoin Valuation Remains Under Its Long-Term Average
The MVRV Z-Score compares Bitcoin’s market value with the value of coins based on when they last moved. Traders use the metric to assess whether BTC is trading above or below its typical valuation range. Because the measure uses realized value, it is often followed alongside price action to gauge whether recent holders are under pressure or whether the market is returning to healthier profit conditions.
The score has remained below 1.7 over the past month. It also dropped to about 0.185 on June 30, the lowest level of the current cycle, before recovering as Bitcoin moved higher.
Bitcoin has recently traded between $64,000 and $66,000 after declining about 15% over three months. The narrow trading range reflects caution among buyers and sellers ahead of the Federal Reserve’s next interest rate decision, a macro event closely watched by crypto traders because interest-rate expectations can affect liquidity conditions and risk appetite across markets.
CryptoQuant data shows that investors realized net losses during most of the past 30 days. Realized losses reached about $8.5 billion in June, followed by nearly $3 billion in mid-July.
That pattern shifted over the past week. Realized profit and loss turned positive, with daily gains ranging from $400 million to $500 million. The latest reading was near $239 million, indicating that selling pressure has eased.
No Clear Capitulation Signal Has Appeared
Previous Bitcoin bottoms often formed after the MVRV Z-Score fell below zero. In late 2022, the metric stayed negative for several weeks while BTC traded near $16,000 to $17,000.
Bitcoin’s current valuation remains above that level. Holders have reduced selling, but the market has not shown the same panic conditions that accompanied the previous bear-market low. That leaves the current setup between two clearer historical signals: below-average valuation without the negative readings usually associated with broad capitulation.
Analyst Crazzyblockk said the market may be moving through a deep reset without a full capitulation event. Bitcoin has gained about 6% since trading near $60,000 in late June.
A move in the Z-Score toward 1.7 would indicate stronger valuation conditions. It could also support a broader price recovery if demand continues to improve.
A decline below 0.185 would suggest a different setup. Negative readings could point to renewed stress and additional losses before Bitcoin establishes a stronger base.

