Bitcoin Holds Key Support as ETF Holdings Remain Below Peak
Key Takeaways
- •US spot Bitcoin ETF holdings remain near 1.2 million BTC, below their almost 1.38 million BTC peak but well above post-launch levels.
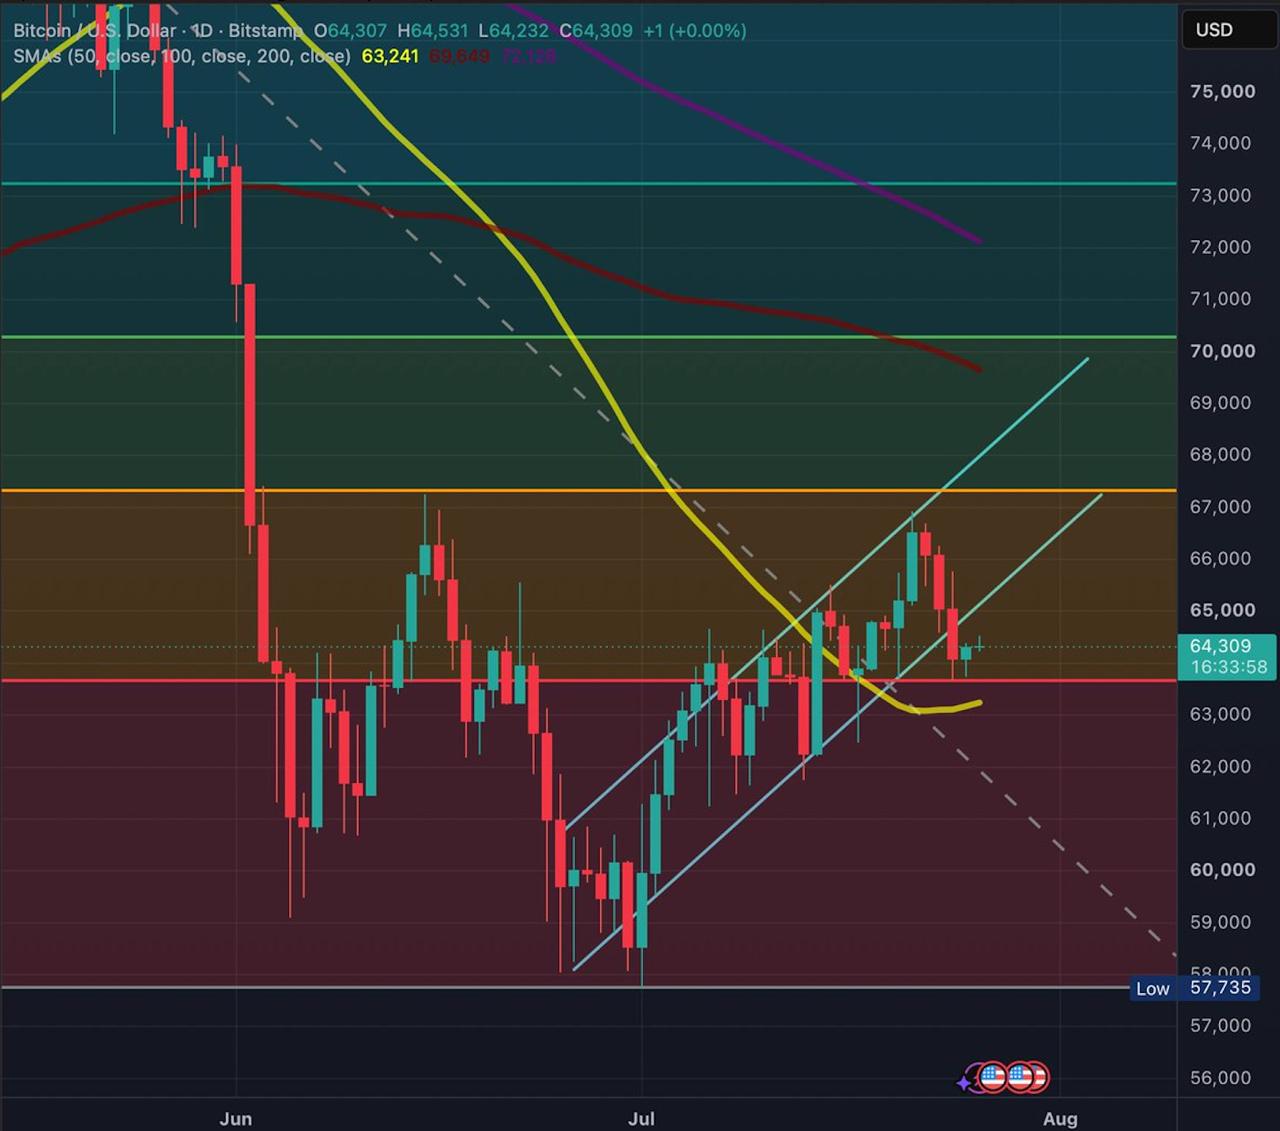
- •Bitcoin has held support around $63,600, while the 50-day simple moving average near $63,240 remains the final short-term floor if that level fails.
- •A daily close above $67,300 would strengthen the rebound, but the larger resistance zone sits near $69,650 to $70,250.
- •CryptoQuant data showed some of the strongest average ETF inflows occurred when Bitcoin traded around $115,000 to $125,000, not at lower price ranges.
- •The SEC’s approval of spot Bitcoin exchange-traded products in January 2024 and in-kind creations and redemptions in July 2025 improved regulated market access.
US spot Bitcoin exchange-traded products remain an important part of Bitcoin’s current price structure, with aggregate holdings still near 1.2 million BTC. That figure is below the peak of almost 1.38 million BTC, but it remains well above the level recorded shortly after the products launched in January 2024.
The two data points point to resilience rather than renewed demand. Bitcoin has held an important technical support area, while the institutional ownership base has remained in place through the drawdown. However, neither measure shows that fresh capital is entering at current price levels.
The first resistance level is the 0.382 Fibonacci retracement near $67,300. A move through that level would extend the rebound, but the larger test sits higher, where the 0.5 retracement around $70,250 aligns with the 100-day simple moving average near $69,650.
Bitcoin Holds the 0.236 Retracement
The retracement levels are measured from the May swing high near $82,700 to the $57,800 low. That range places the 0.236 retracement at about $63,600, making it the first level buyers needed to regain during the recovery.
Bitcoin’s latest pullback returned the price to that area. Buyers responded before the daily structure broke, and the 50-day simple moving average below it was not tested.
That defense keeps the recovery attempt intact, although it does not remove the resistance created by the earlier decline. A recovery of $67,300 would show that buyers can push the price beyond the latest local high. Reclaiming the higher cluster would put Bitcoin back above a falling medium-term average and break the pattern of lower resistance levels.
The 200-day simple moving average remains near $72,100. As a result, Bitcoin is holding a constructive short-term structure while still trading below its two longer moving averages. These levels matter because they are common reference points for short- and medium-term traders, but they remain signals to monitor rather than guarantees of direction.
ETF Holdings Are About 180,000 BTC Below Their High
According to CryptoQuant’s analysis of aggregated spot Bitcoin ETF holdings, the products held around 620,000 BTC after launch and later rose to nearly 1.38 million BTC.
The decline from that peak remains significant at roughly 180,000 BTC, or about 13% of the previous high.
ETF holdings can move in both directions. Investors may redeem shares, reduce exposure or rebalance portfolios as conditions change, and the drawdown reflects that process.
Even after the decline, holdings remain almost twice the level recorded shortly after the products launched. The pullback followed a period in which aggregate Bitcoin ETF holdings climbed above 1.37 million BTC as institutions absorbed supply returning from older holders.
Because spot Bitcoin ETF shares are backed by Bitcoin exposure held through the product structure, aggregate holdings are a useful measure of demand inside regulated wrappers. They do not capture all Bitcoin demand, but they show whether this specific access channel is expanding or contracting.
Strongest Inflows Occurred Above $115,000
CryptoQuant’s price-range data challenges the assumption that ETF investors primarily wait for lower Bitcoin prices before allocating capital.
Some of the strongest average inflows occurred when Bitcoin traded between approximately $115,000 and $125,000. Several lower and middle price ranges showed smaller or mixed flows.
That means price discounts alone are not the main driver of institutional allocation. Investors may enter after momentum improves, once portfolio committees approve exposure, or when broader risk conditions become more favorable.
For that reason, the area around $63,600 should not be interpreted as automatic institutional support. The scale of ETF holdings shows that regulated capital has entered Bitcoin, but only new inflows can show whether that capital is returning at this price level.
A separate analysis of Bitcoin’s price against institutional flows across the $53,000 to $70,000 range reached a similar conclusion: ETF demand can indicate whether a correction is becoming stretched, but it cannot guarantee that any specific support level will hold.
ETF Structure Changed Market Access
The US Securities and Exchange Commission approved the listing and trading of spot Bitcoin exchange-traded products in January 2024. The products allowed investors to gain exposure through ordinary brokerage and investment accounts without managing private keys or arranging direct cryptocurrency custody.
That structure removed several practical obstacles for financial advisers, asset managers, pension-related investors and institutions operating under formal compliance and audit requirements.
The infrastructure changed further in July 2025, when the SEC approved in-kind creations and redemptions for crypto exchange-traded products. Authorized participants could then exchange Bitcoin directly for product shares. The earlier cash-only model had added trading costs and market friction, which the change reduced.
That access route helps explain the shape of the drawdown. Holdings declined, but the structure supporting those holdings remained intact throughout the move. The next distinction is whether that infrastructure simply preserves existing exposure or begins to register renewed net creations.
$67,300 Marks the Next Test, With $70,000 as the Larger Barrier
The constructive path depends on the 0.236 retracement continuing to hold while Bitcoin challenges the 0.382 level. A daily close above $67,300 would open the way toward the higher cluster, and a clean recovery followed by a successful retest would shift the move from a rebound into a broader trend challenge.
ETF data would add support to that reading. If net inflows returned while aggregate holdings stopped declining, the move would have a demand base and would depend less on technical positioning alone.
A break above $67,300 without improving flows would still be constructive, but it would remain exposed to rejection where the 0.5 retracement meets the 100-day average.
A Loss of $63,600 Would Leave the 50-Day Average as the Last Short-Term Floor
A daily close below the 0.236 retracement would remove the level buyers just defended and leave the 50-day simple moving average at $63,240 as the final short-term floor. Losing that level as well would weaken the lower boundary of the rising channel and shift momentum back toward sellers.
The first area exposed below the moving average is around $60,000, where Bitcoin traded repeatedly in late June and early July. The $57,800 low remains the deeper reference point, and a return to that level would erase the entire retracement structure built since the end of June.
Continued redemptions during such a decline would show the institutional base shrinking alongside price rather than cushioning the move.
Bitcoin currently has a defended floor and an institutional base that survived the drawdown. Confirmation of the recovery would require two developments that the market has not yet produced: a reclaim of the $69,650 to $70,250 cluster and renewed expansion in ETF holdings.
Methodology: Technical levels are based on the daily BTC/USD Bitstamp chart as of [DATE], with Fibonacci retracements measured from the $82,770 swing high to the $57,726 low. ETF holdings and price-range flow data are taken from the linked CryptoQuant analysis. Regulatory details are sourced from official US Securities and Exchange Commission statements.

