Shiba Inu Gains More Than 30% in Two Sessions as 200-Day SMA Comes Into Focus
Key Takeaways
- •SHIB gained roughly one-third across two sessions and reached the 200-day SMA near $0.00000584 before pulling back.
- •Coinglass data showed about $2.65 million in 24-hour SHIB liquidations, with shorts accounting for roughly $1.93 million.
- •Derivatives activity dominated trading, with OKX futures volume near $432 million, far above spot-market activity.
- •The 14-day RSI rose to about 81, increasing the likelihood of consolidation or a pullback.
- •A daily close above the 200-day SMA would point toward the 0.382 Fibonacci level near $0.00000639.
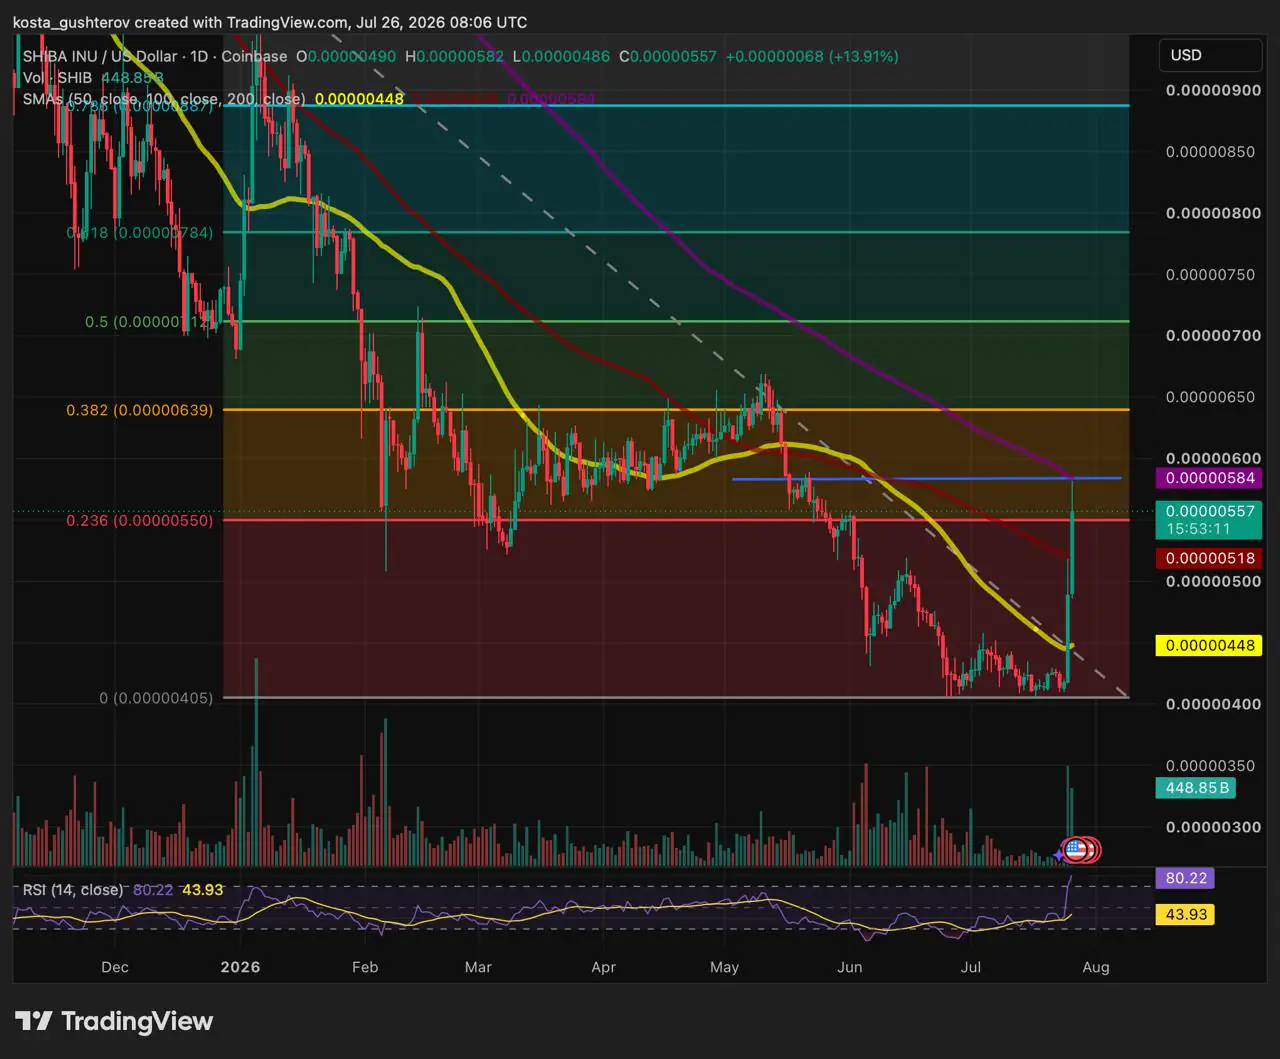
Shiba Inu (SHIB) has extended a sharp two-session rally, with gains now totaling roughly one-third of the token’s value. The move has cleared two consecutive resistance levels, but it has also pushed momentum indicators into stretched territory and highlighted the role of derivatives activity in the advance.
The session high landed almost exactly at the 200-day simple moving average (SMA) of $0.00000584, the last major moving average still sitting above price. SHIB’s close remained above both the 100-day SMA at $0.00000519 and the 0.236 Fibonacci retracement at $0.0000055, the level that capped the prior session.
Together with the previous day’s 18% surge, SHIB has gained roughly a third of its value across two sessions. The rally has broken through two resistance areas in succession, while the 14-day relative strength index (RSI) has climbed to approximately 81, placing it deep in overbought territory. For a token that often trades with high retail participation and rapid sentiment shifts, the combination of a long-term moving-average test and elevated leverage makes confirmation especially important.
Short Positions Take the Brunt of the Squeeze
Liquidation data from Coinglass shows that leveraged short positions absorbed most of the pressure during the rally. Over the past 24 hours, approximately $2.65 million in SHIB positions were liquidated, with short positions accounting for about $1.93 million of that total. That is more than 2.5 times the amount liquidated on the long side.
The imbalance was even more pronounced in the most recent four-hour period. During that window, shorts represented roughly $508,000 of the $773,000 in total SHIB liquidations.
Funding-rate data provides additional context for the squeeze. SHIB’s open-interest-weighted funding rate had already been consistently positive through much of July, with the largest spikes occurring in the days immediately before this week’s advance. Positive funding means leveraged longs were paying a premium to maintain their positions, indicating that bullish positioning had already been building in the derivatives market before the breakout.
That positioning likely amplified the move once SHIB moved above the 100-day SMA and forced short sellers to cover. Taken together, the liquidation imbalance and funding-rate trend point to a rally with a significant leverage-driven component. That does not exclude genuine spot demand, but it indicates that part of the move reflected forced buying rather than new conviction alone.
Futures Activity Outpaces Spot Trading
Exchange data shows that most trading activity is concentrated in derivatives rather than spot markets. Spot volume was led by Upbit at approximately $57.6 million and Binance at around $41.6 million, while OKX, Bybit, Gate and Coinbase trailed well behind.
By contrast, futures volume on OKX alone reached approximately $432 million. That figure was more than seven times OKX’s own spot volume and roughly 10 times the combined spot volume across all listed exchanges.
The concentration of activity in futures markets aligns with the liquidation and funding data, both of which point to a leverage-heavy advance. In futures-led moves, price can travel quickly because traders are using borrowed exposure, but the same structure can also make intraday reversals sharper when positions are unwound or funding costs become less attractive.
200-Day SMA Becomes the Key Technical Level
With the 100-day average and the 0.236 Fibonacci retracement now cleared, the 200-day SMA at $0.00000584 has become the next major technical test. The current session’s high already touched that level before price pulled back.
The 200-day SMA is widely followed because it smooths roughly a year of daily trading sessions and is often used to distinguish longer-term trend pressure from shorter-lived rallies. The zone carries additional weight because it aligns almost exactly with horizontal resistance from SHIB’s February consolidation high. That gives the area confirmation from both a moving average and previous price action, rather than from the 200-day SMA alone.
A daily close above that confluence would be the first since SHIB’s decline began and would open room toward the 0.382 Fibonacci retracement near $0.00000639. If price is rejected at the 200-day SMA, the move would resemble the prior session’s test of the 100-day SMA: a resistance challenge without confirmation.
In that scenario, the reclaimed 100-day SMA near $0.00000519 becomes the first level to hold, followed by the 0.236 Fibonacci retracement near $0.0000055.
An RSI reading above 80 increases the likelihood of consolidation or a pullback before any further extension, regardless of where the daily candle closes relative to the 200-day SMA. Two consecutive sessions of double-digit gains, both driven substantially by futures activity, typically require time to digest before they can be assessed as a durable trend change rather than a leverage-fueled spike.
Disclaimer: This article is for informational and analytical purposes only and does not constitute financial or investment advice. SHIB is a volatile asset, and technical indicators or historical price patterns cannot guarantee future performance. Readers should conduct their own research before making financial decisions.
Methodology: Technical levels are based on the daily SHIB/USD Coinbase chart via TradingView, captured July 26, 2026. Liquidation, funding-rate and exchange-volume data are from Coinglass.

