Shiba Inu Gains More Than 35% in a Week as SHIB Short Liquidations Rise
Key Takeaways
- •SHIB was trading near $0.0000057 after gaining more than 35% on the weekly candle.
- •The token was testing a descending trendline formed from lower highs in 2025, but it had not clearly closed above it at the time of the report.
- •CoinGlass data showed roughly $2.32 million in SHIB futures liquidations over the previous day, with about $1.77 million from short positions.
- •Futures net inflow into SHIB rose by more than 2,000% from the prior day, while open interest stood near $64.7 million.
- •A move below the $0.0000048 flag low on the 15-minute chart would weaken the short-squeeze interpretation of the rally.
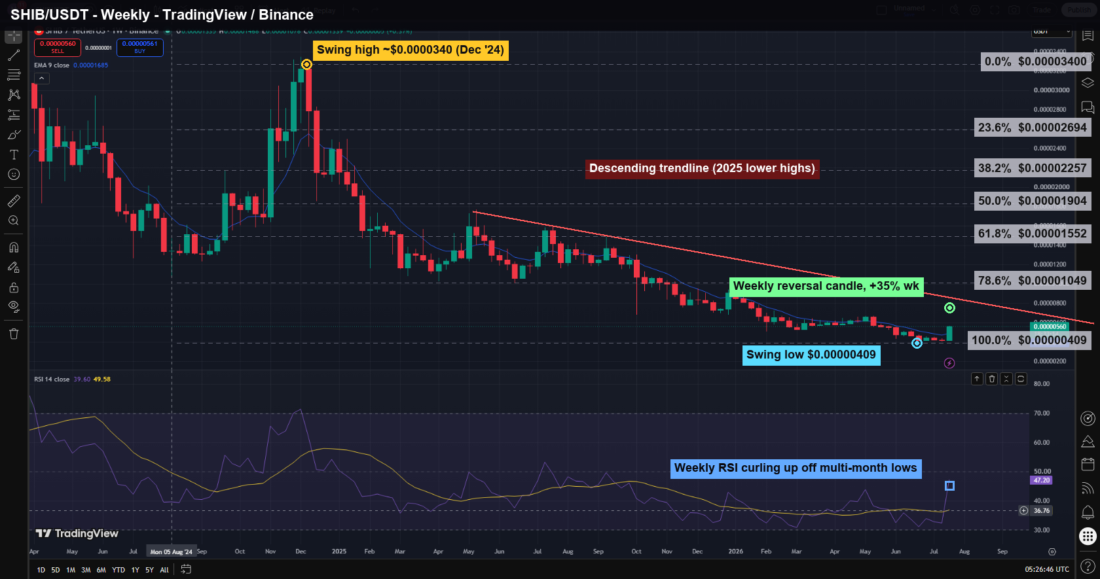
Shiba Inu rose by more than one-third over the past week, while short positions in SHIB futures were liquidated rapidly. The move has brought renewed attention to the token’s weekly structure and its shorter-term 15-minute price action.
SHIB had spent much of 2026 trading with little notable movement before the chart shifted around midday Saturday. At the time of the original report, SHIB was trading near $0.0000057, with its weekly candle showing a gain of more than 35%.
That scale of weekly advance is unusual for the token in recent trading history. It also follows a longer period in which SHIB had been grinding lower from a base that traced back to December 2024. For a heavily traded meme token, sharp moves can draw added attention because derivatives positioning can amplify short-term volatility when leveraged traders are forced to close positions.
Multi-Year Downtrend Comes Under Pressure
On the weekly chart, SHIB’s broader structure remains defined by a prolonged decline. The token topped out near $0.0000340 around December 2024, according to the chart referenced in the source, and then moved lower through a series of weaker rebounds. That sequence formed a descending trendline built from lower highs through 2025, with price remaining below it for months.
This week’s candle has become the first notable test of that structure. SHIB printed a low of $0.00000409 seven days earlier, and since then the price has been testing the descending trendline drawn from the 2025 highs. The token had not closed clearly above that level at the time of writing, although the candle wick had moved through it.
SHIB/USDT weekly chart, TradingView / Binance. The 2025 descending trendline is under real pressure for the first time since it formed.
Even after the more than 35% weekly move, SHIB remained far below the 23.6% Fibonacci retracement of the full 2024-to-2026 decline. That level is around $0.0000269, more than four times the price at which SHIB was trading at the time of the report. Weekly RSI was only beginning to turn upward from the low 30s, indicating that the move was still a rebound from depressed levels rather than confirmation of a recovered broader trend.
Derivatives Data Shows Heavy Short Liquidations
Derivatives data from CoinGlass showed that the move coincided with a sharp round of short liquidations. Roughly $2.32 million in SHIB futures positions were liquidated over the previous day, with about $1.77 million of that total coming from short positions.
Futures net inflow also increased sharply. According to the data cited in the source, money moved into SHIB futures at a pace more than 2,000% higher than the previous day. Open interest was near $64.7 million at the time, with positioning still adjusting after the price move.
Liquidation data is useful because it shows where leveraged positions were forcibly closed, but it does not by itself explain why spot buyers entered or whether demand will persist. The data does not establish a single broader catalyst for the rally. It does show that a significant number of traders positioned short were forced out as SHIB moved higher.
15-Minute Chart Shows Two-Part Move
On the 15-minute chart, the advance was divided into two clear legs. The first leg took SHIB from about $0.0000042 to around $0.00000504 before momentum slowed and the token moved into a flag formation.
The pullback during that flag was limited. SHIB dipped only slightly beyond the 23.6% Fibonacci level of the first leg, near $0.0000048, before buyers returned. An ascending trendline drawn from the launch point and the flag low was still holding beneath the second leg at the time of the report.
SHIB/USDT 15 minute chart, TradingView / Binance. The flag pullback barely dented the first leg before the second breakout started.
RSI reached roughly 87 during the first leg, a level commonly considered deep overbought territory. It then cooled during the flag without a clear bearish divergence and later climbed back into the high 70s during the second push. On its own, that reading was not described as a warning signal, though it would become more relevant if RSI began weakening while price continued moving higher.
Key Price Levels in Focus
If the move holds, the descending 2025 trendline near the current price remains the main level to watch on the weekly chart. A close above that trendline would mark the first such close in more than a year.
On the downside, the $0.0000048 flag low on the 15-minute chart is the more immediate level. A move below that area would weaken the short-squeeze interpretation of the advance.
The source characterized the analysis as a reading of the chart and derivatives data available at the time of writing, not financial advice. It also noted that SHIB has previously broken trendlines only to resume declining, meaning the current move remains a bounce unless the price structure confirms otherwise.

