Litecoin Tests $47.60 Resistance as Analyst Tracks Potential LTC Breakout
Key Takeaways
- •Litecoin was trading at $47.62 after rising 3.29% over the past 24 hours, according to CoinGecko.
- •Cryptorphic identified $47.60 as the main resistance level that could shape Litecoin’s next move.
- •The analyst’s chart shows an ascending triangle formed by rising support and a flat resistance area near $47.60.
- •A confirmed close above $47.60 would point to an initial target range of $48.50 to $49.00, according to the analysis.
- •The $46.00 level is viewed as important support because it aligns with moving averages and a prior breakout area.
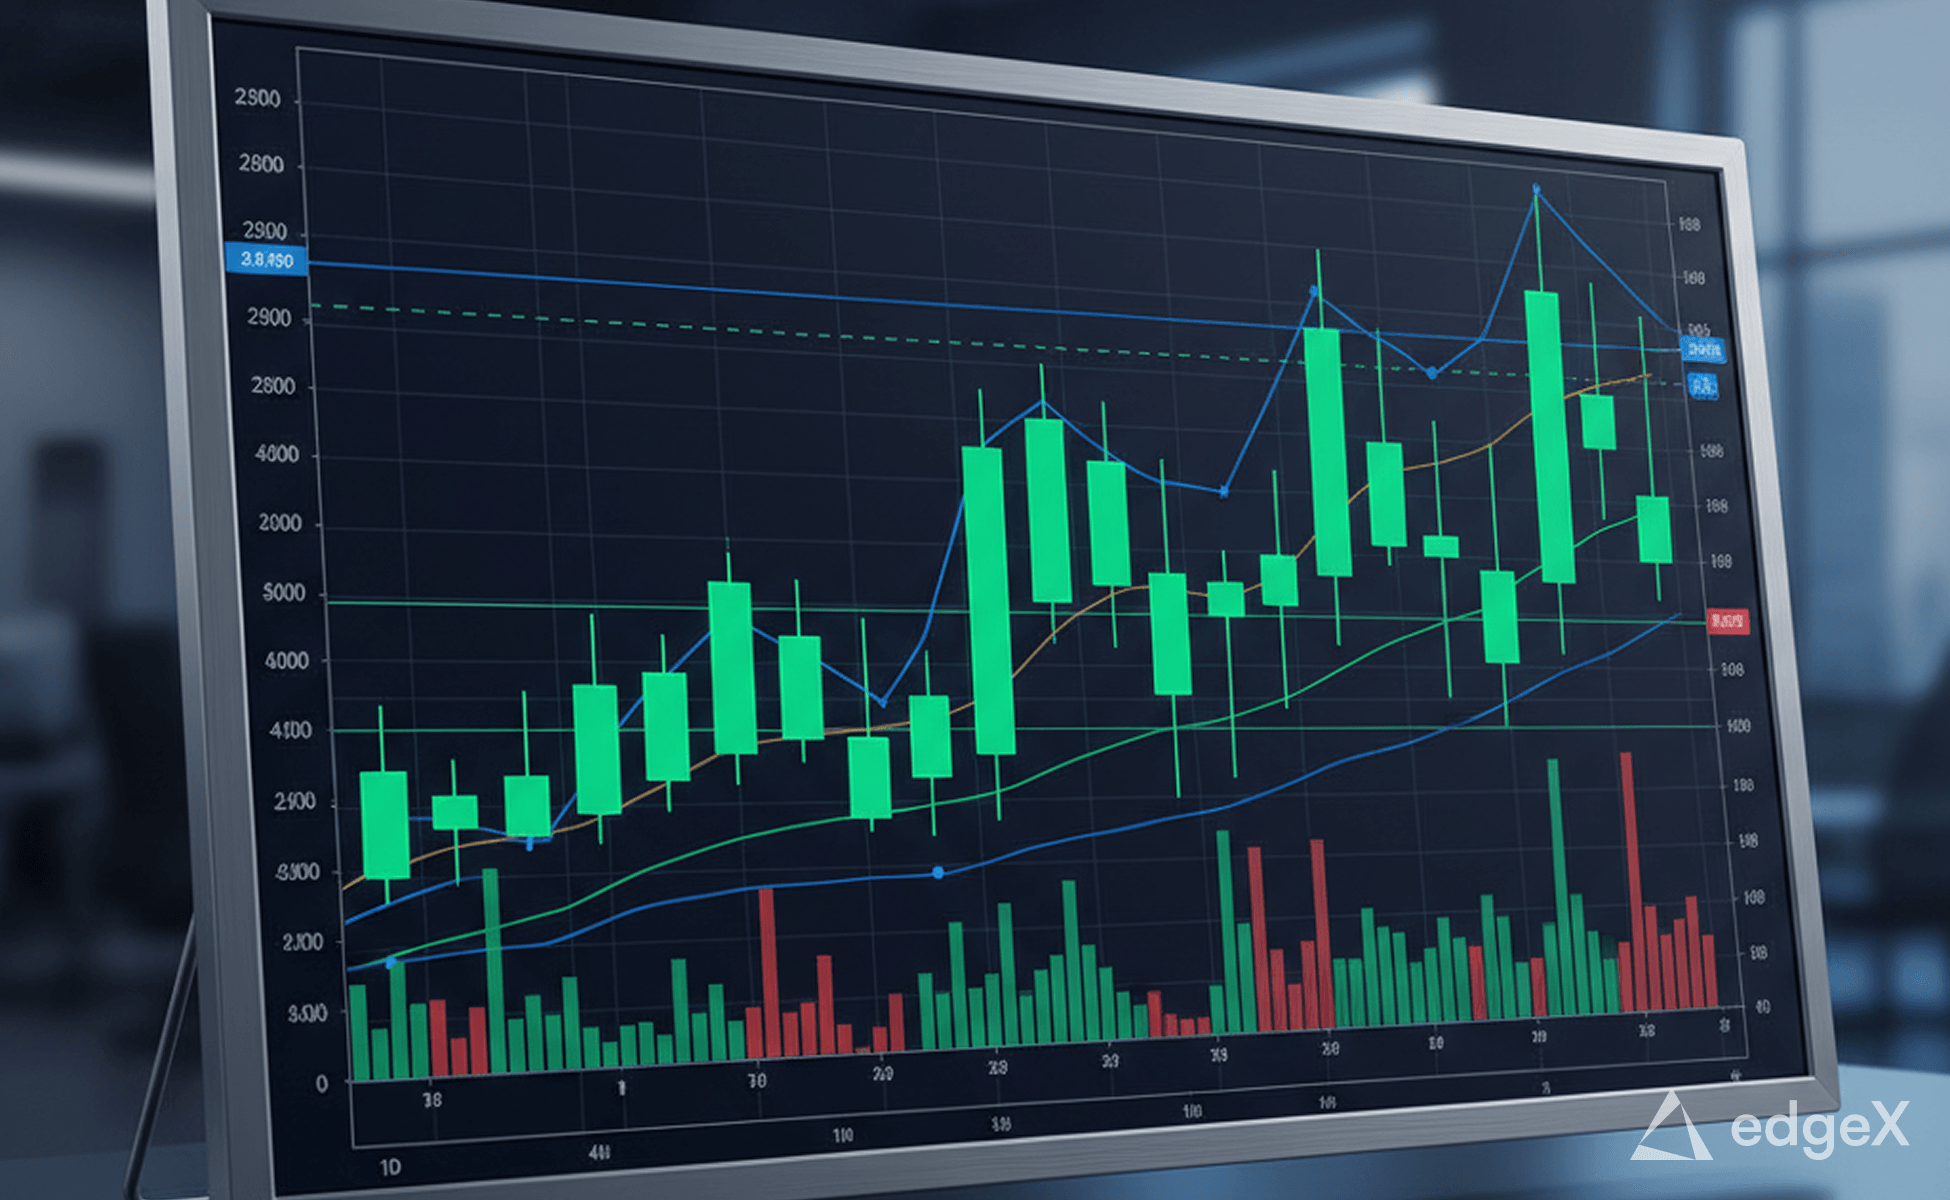
Litecoin is trading near a key resistance level at $47.60 as its recent price structure continues to strengthen, according to analysis from Cryptorphic. The analyst identified $47.60 as the level that could determine Litecoin’s next major move.
LTC has been forming higher lows since recovering from a sharp decline in June. Pullbacks have repeatedly been defended along a rising trendline, keeping the broader structure intact.
According to CoinGecko, LTC was trading at $47.62, up 3.29% over the past 24 hours. Trading volume over the same period reached $218,996,786, indicating continued activity around the current price zone. For a long-running asset such as Litecoin, traders often focus on whether price can hold above established technical levels because liquidity around these areas can determine whether a move gains follow-through or stalls.
Litecoin Builds Momentum Near Resistance
Cryptorphic’s six-hour chart shows LTC pressing against the $47.60 resistance area across several sessions. Each attempt to break above that level has failed so far, but repeated tests of resistance are often watched by traders because they can signal a weakening ceiling if buying pressure continues.
The analyst’s setup shows Litecoin moving from a clear downtrend into a consolidation phase with improving momentum. LTC has also gained 1.16% over the past week.
The coin continues to trade above both its short-term and long-term moving averages. In technical analysis, that alignment is commonly viewed as a sign of strengthening conditions after a period of accumulation.
I’m starting to pay more attention to $LTC here.
Price has been building a solid bullish structure, with the rising trendline continuing to hold and buyers defending the recent pullbacks. Now LTC is pressing against the $47.60 resistance area.
A clean breakout above this level… pic.twitter.com/oXzCCLfbGE
— Cryptorphic (@Cryptorphic1) July 26, 2026
https://x.com/Cryptorphic1/status/2081318532395008176?ref_src=twsrc%5Etfw
Ascending Triangle Pattern Draws Attention
The chart also shows an ascending triangle formation, a pattern monitored by many technical traders. In this setup, Litecoin’s price is compressing between a rising support trendline and the flat resistance ceiling near $47.60.
Such patterns are often associated with upside breakout potential when buyers continue to defend higher lows. In this case, the rising trendline has held through each recent pullback. Traders typically look for a confirmed close above resistance, rather than a brief move through it, because failed breakouts can quickly return price to the prior range.
Cryptorphic noted that buyers have continued to defend higher levels instead of allowing deeper corrections. The analyst described this behavior as a sign of accumulating demand rather than fading interest.
A confirmed close above $47.60 would validate the breakout from the triangle pattern, according to the analysis. The next initial target identified in the setup is the $48.50 to $49.00 region.
Support Levels and Price Targets
The $46.00 area is the first meaningful support level below the current price. That zone aligns with both moving averages and a previous breakout region from earlier price action.
Holding above $46.00 would keep the broader bullish structure intact. A drop below that area would suggest the setup may need more time to develop.
A loss of the rising trendline would also weaken the current bullish case and could point to further consolidation before another breakout attempt.
For now, Cryptorphic’s analysis places $47.60 as the main level to watch. Traders following LTC are expected to monitor that resistance area alongside the rising trendline that has framed Litecoin’s recovery since June.

