Ethereum Price Pulls Back as Network Metrics Show Early Recovery Signs
Key Takeaways
- •ETH pulled back toward $1,876 on July 23 after briefly approaching $1,933 during its recent rally.
- •Median priority fees rose nearly 86% over the past week, while median transaction fees increased about 16% from low levels.
- •New smart contract deployments are running nearly 190% above their 90-day average, indicating continued development activity on Ethereum.
- •Binance funding rates fell about 28% over the past week, suggesting the rally was not mainly driven by leveraged long positions.
- •Ethereum staking reached a record 33.69% of total supply as exchange reserves declined across major platforms.
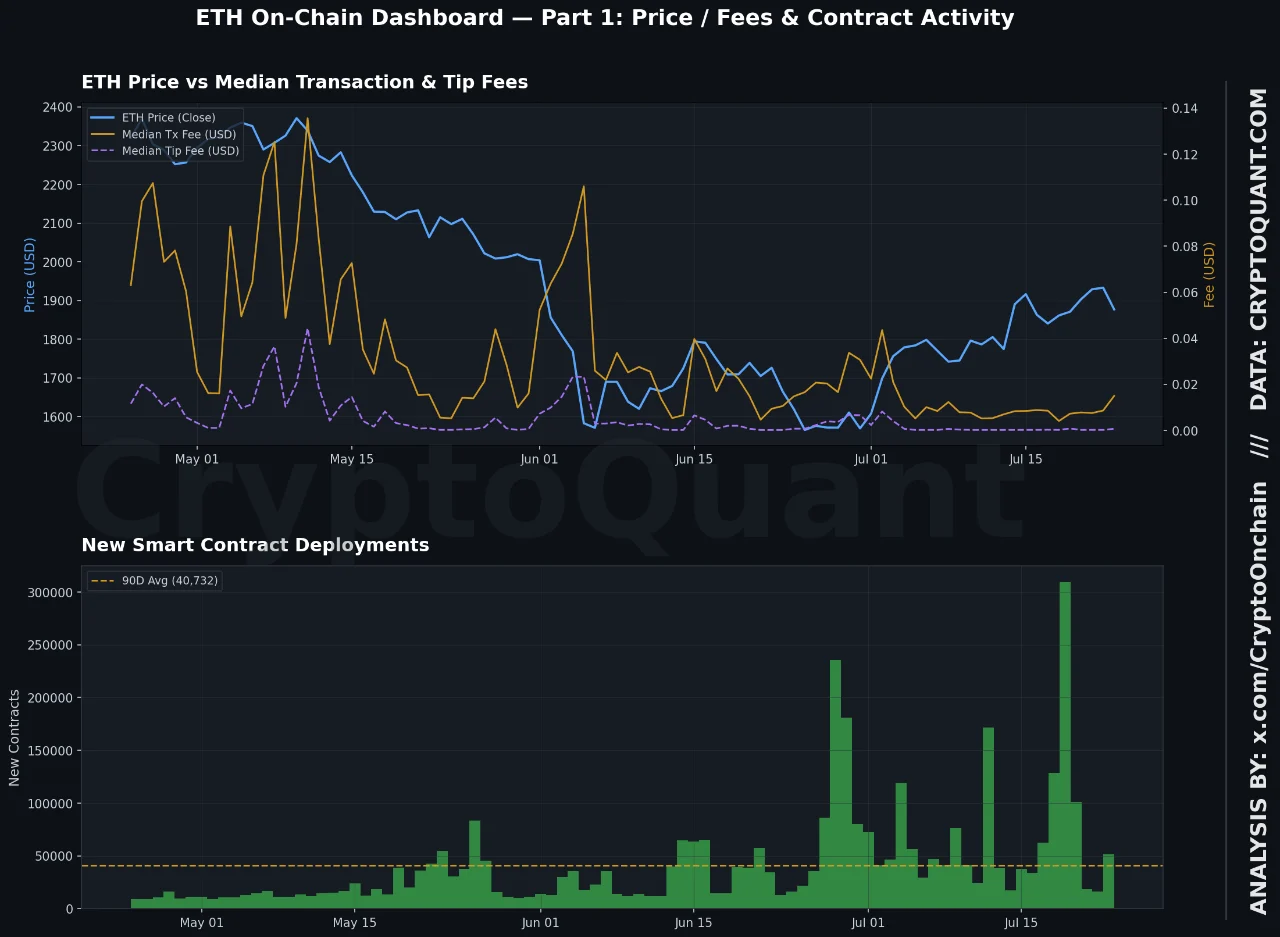
Ethereum’s recent price rally has cooled after ETH climbed from $1,796 to nearly $1,933 before easing toward $1,876 on July 23. The move left the asset below its latest peak even as several Ethereum network indicators began showing early signs of improvement.
Data from CryptoQuant showed rising fee pressure, stronger smart contract deployment, lower leverage, and falling reserves across selected exchanges. Ethereum also traded about 17% below its estimated realized price near $2,300, a metric that compares market price with the average on-chain acquisition cost. According to CryptoQuant, only two of five tracked indicators had reached historical reversal zones, meaning a market bottom remained unconfirmed.
Binance’s ETH reserves have fallen from nearly 5 million ETH to around 3.8 million ETH over the past year, reducing liquid exchange supply as Ethereum trades near $1,800. At the same time, Ethereum staking has reached a record 33.69% of total supply, while lower exchange balances point to tighter liquid availability.
Ethereum Fees Begin to Recover
Ethereum transaction costs remained weak for much of the past three months. Median transaction fees traded more than 82% below their 90-day average, while median priority fees stood about 96% below their normal level.
More recent figures show a shift in direction. Median priority fees rose nearly 86% over the past week, while median transaction fees increased by about 16% during the same period.
Those gains began from low levels, so fee pressure remains below longer-term averages. Even so, the latest increase indicates that demand for block space is returning after months of reduced activity.
Higher fees can reflect more transactions competing for inclusion on the Ethereum network. Because ETH is used to pay transaction fees, changes in fee activity are closely watched as a direct measure of demand for Ethereum block space. The current increase is also occurring alongside stronger development activity, providing another measure of renewed Ethereum usage.
Smart Contract Deployments Remain Above Average
New smart contract deployments are running nearly 190% above their 90-day average. The data indicates that developers continue to launch applications and update activity on Ethereum’s base layer.
Contract deployment does not directly guarantee higher ETH prices. However, it is a measure of ongoing development across decentralized finance, tokenization, gaming, and other on-chain applications.
The rise in deployments comes as transaction fees begin to recover. Together, those indicators suggest that Ethereum is seeing activity beyond leveraged market positioning.
Ethereum’s price has not matched the pace of the development data. ETH continues to trade near $1,800, well below higher levels recorded during 2025. That gap keeps attention on whether network growth can later support stronger market demand.
Leverage Declines as Exchange Flows Shift
Derivatives activity has cooled during the recent price move. Binance funding rates fell about 28% over the past week, reducing evidence that leveraged long positions drove the rally.
Lower funding rates generally indicate less aggressive demand in perpetual futures markets. That reading supports the view that Ethereum’s recent activity has not been led mainly by speculative leverage.
Exchange flows also changed as ETH approached its recent peak. Ethereum recorded a net outflow of about 73,000 ETH on July 20. Flows later shifted toward modest inflows as the price reached $1,933 and began to retreat.
The change suggests that some traders moved ETH back to exchanges during the pullback. Still, broader reserve data shows that major platforms hold fewer coins than they did earlier in the year.
ETH Staking and Reserve Data Point to Tighter Supply
Ethereum staking has reached 33.69% of total supply, setting a new high. A larger staked balance reduces the amount of ETH available for immediate trading in the liquid market, although staked ETH can still re-enter circulation through the network’s withdrawal process.
Exchange balances are also declining. About 658,600 ETH, valued at nearly $1.24 billion, has left Gemini and Bitfinex. Gemini reserves dropped to 384,400 ETH, their lowest level since March 2024.
Gemini has lost about 188,600 ETH since April, while Bitfinex reserves have declined by roughly 470,000 ETH since May. Binance holdings have remained near 3.8 million ETH after falling from almost 5 million ETH over the past year.
The supplied data also places ETH below its realized price, a level often tracked during accumulation phases. Falling reserves can reduce immediate selling supply, but they do not confirm a market bottom.

