Bitcoin, XRP and Dogecoin Face Key Support Tests on July 25
Key Takeaways
- •Bitcoin is testing support near $63,700 after slipping below $64,200 during intraday trading.
- •A confirmed Bitcoin break below $63,700 could expose a move toward $62,700, while recovery above $64,200 could improve the short-term outlook.
- •XRP traded near $1.059 after testing the $1.063 downside area, with all four cited indicators favoring sellers.
- •Dogecoin remained confined to a narrow range between about $0.0684 and $0.070, leaving traders without a clear directional signal.
- •Dogecoin’s indicators were mostly bearish, though its Ultimate Oscillator was the only positive reading among the cited DOGE measures.
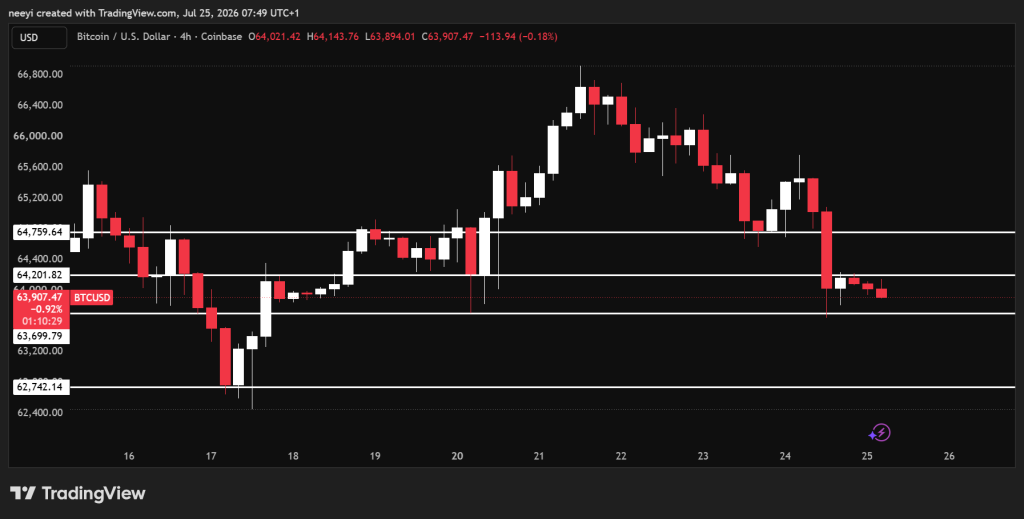
Bitcoin, XRP and Dogecoin came under renewed selling pressure on July 25 after buyers failed to hold several short-term price levels. BTC began to decline on Friday morning, and weakness later spread across XRP and DOGE.
Technical indicators for all three assets currently lean bearish, although nearby support levels may still produce temporary rebounds. These levels matter because short-term traders often use support and resistance zones to judge whether selling pressure is stabilizing or accelerating. Bitcoin is approaching a key test near $63,700, XRP is attempting to hold its current support region, and Dogecoin remains confined to a narrow trading range.
Bitcoin’s Direction Hinges on the $63,700 Area
Bitcoin started falling from a Friday morning peak near $65,760. The BTC price later moved down toward $63,900, slipping slightly below the important $64,200 level.
Current market data puts Bitcoin near $63,932 after an intraday decline of about 2.25%. BTC reached a daily high near $65,717 before dropping to an intraday low of about $63,703.
The move has brought Bitcoin close to support around $63,700. If buyers defend that level, BTC could move back toward $64,200. In that scenario, Bitcoin may continue trading between the two levels if neither buyers nor sellers gain decisive control.
Selling pressure would become more significant if BTC breaks below $63,700. Such a move could open a path toward $62,700 before the end of the day.
A recovery above $64,200 would strengthen the short-term outlook. Bitcoin could then target $64,760 before another possible move toward $65,500.
Bitcoin Indicators Favor Sellers While $63,700 Remains in Focus
Bitcoin’s technical indicators currently favor sellers. Each indicator measures a different part of the BTC price structure, but all four are producing bearish readings at the moment.
The Relative Strength Index stands at 37.552. This reading indicates that selling pressure remains stronger, although Bitcoin has not reached the traditional oversold threshold below 30.
The Moving Average Convergence Divergence reading is negative 197.6. A negative MACD figure shows that short-term price strength remains weaker than the longer market trend.
The Ultimate Oscillator reads 40.359. This indicator combines several time periods to measure market pressure. A reading below 50 supports the bearish outlook because buying strength remains limited.
Bull and Bear Power stands at negative 1,410.066. The deeply negative reading shows that sellers currently have greater control over Bitcoin’s short-term price direction.
The overall indicator summary remains bearish, but Bitcoin’s reaction near $63,700 is the key short-term point to watch. A rebound could return BTC to $64,200, while a confirmed breakdown could expose $62,700. Because technical indicators are based on recent price action, traders typically watch the actual price response at support alongside the indicator readings.
XRP Faces Another Important Support Test
XRP has posted three consecutive daily declines. Another negative close on July 25 would extend the bearish sequence to four days.
The XRP price began the analysis near support around $1.081. A break below that area could push Ripple’s token toward $1.063 during the day.
Current market data places XRP close to $1.059, meaning the token has already tested the lower bearish target. That makes the price reaction around $1.063 especially important.
A recovery above $1.081 could move XRP back into its earlier consolidation area between $1.081 and $1.10. Buyers would need to reclaim $1.10 before the short-term picture becomes more constructive.
A confirmed breakout above $1.10 could take the XRP price toward $1.12. If XRP fails to recover above $1.063, Ripple’s token could remain exposed to further selling pressure.
XRP Remains Bearish Below $1.10
XRP’s RSI stands at 37.934. The reading confirms weak demand, although the token remains above the traditional oversold boundary of 30.
The MACD reading is negative 0.006. That small negative figure means XRP still lacks enough strength to reverse its recent decline.
The Ultimate Oscillator reads 34.092. This value shows that sellers remain dominant across the periods measured by the indicator.
Bull and Bear Power stands at negative 0.0288. The reading adds further support to the bearish XRP price outlook because sellers continue to control the immediate structure.
All four XRP indicators favor sellers. Ripple’s token needs to recover above $1.081 before it can challenge $1.10 and reduce the immediate bearish pressure. Until then, the $1.063 to $1.081 area remains the main short-term zone for judging whether the decline is pausing or continuing.
Dogecoin Stays Inside a Narrow Range
Dogecoin has traded between approximately $0.0684 and $0.070 since Thursday afternoon. During that period, neither buyers nor sellers have established clear control over the DOGE price.
Current market data places Dogecoin near $0.0692. DOGE has recorded an intraday high around $0.070 and a low near $0.0683.
A breakout above $0.070 could send the DOGE price toward $0.0715. Buyers would need stronger volume to maintain that recovery beyond the first target.
A decline below $0.0684 would weaken the current structure. Dogecoin could then fall toward $0.068 before another support test develops.
Dogecoin Needs a Break From the $0.0684 to $0.070 Range
Dogecoin’s RSI reads 34.859. The figure remains close to oversold territory, but it still produces a sell signal because buying strength remains weak.
The MACD stands at negative 0.001. This reading confirms that DOGE has limited upward strength under current market conditions.
The Ultimate Oscillator provides the only positive reading at 54.469. A value above 50 shows that some buying pressure remains present across the periods measured.
Bull and Bear Power reads negative 0.0009. Sellers still hold a slight advantage despite the positive Ultimate Oscillator reading.
Dogecoin’s narrow range makes confirmation especially important. A move outside $0.0684 to $0.070 would give traders a clearer signal than the current sideways action, where small price changes can quickly reverse inside the band.
FAQs
Dogecoin has an uncertain future driven by community hype, but it lacks the deep utility of other networks. Its value trades around $0.069 and relies heavily on social media attention, low transaction fees for micro-tipping, and speculative trading.
XRP reaching $10 is theoretically possible but highly challenging, as it would require a market capitalization exceeding $600 billion. Analysts generally view that level as a long-term, extreme bull-case scenario rather than an immediate probability.
Bitcoin can be used as a payment method for goods or services. A growing number of retailers currently accept bitcoin, and its commercial use continues to expand. Bitcoin can also be used as a currency for international remittance or as an investment.

