Bitcoin Tests Converging Support at $63,500 as Momentum Cools and Volume Stays Quiet
Key Takeaways
- •Bitcoin is testing a confluence of support near $63,500, where the ascending channel floor and the 0.382 Fibonacci retracement at $63,517 nearly overlap, making a breakdown from this level a significantly stronger bearish signal.
- •The 0.236 Fibonacci retracement at $64,838 has flipped from support to resistance after a sharp July 24 decline, meaning buyers must reclaim that level to shift the short-term outlook back to the upside.
- •The OI-weighted funding rate stands at a near-flat 0.0019%, indicating no substantial buildup of leveraged long positions and contrasting with earlier cycle episodes that preceded liquidation cascades.
- •Liquidations over the past 24 hours totaled $68.21 million and were predominantly long positions, a modest figure consistent with profit-taking rather than a leverage-driven sell-off.
- •If the $63,500 support breaks, the next downside targets are $62,450 and $61,382, while a bullish recovery would first require a 4-hour close back above $64,838.
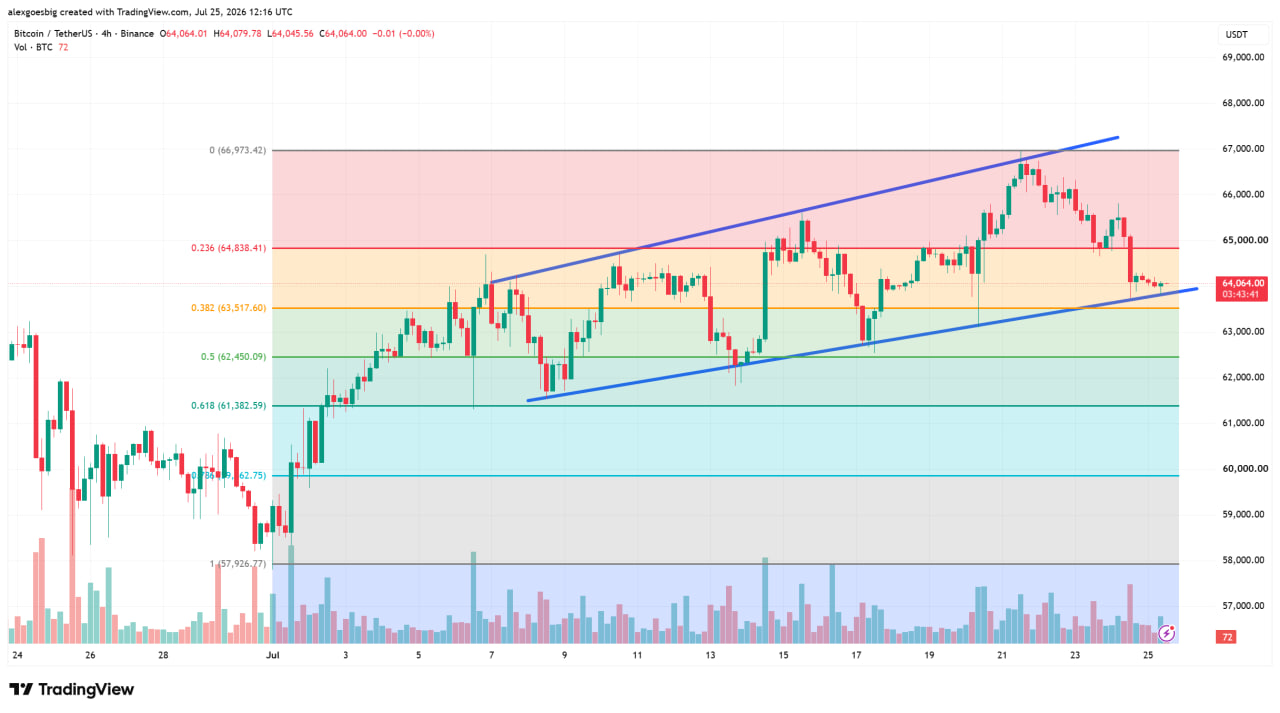
Bitcoin traded at $64,081 on Binance during the early hours of July 25, hovering just above the base of the ascending channel that has defined its upward trajectory since early July. The current pullback began after the price stalled at $66,973 on July 21, gradually pushing the market into the lower third of that channel. The level matters because Bitcoin has been oscillating in the $60,000–$70,000 corridor for months following its March all-time high near $73,700, and each test of the lower boundary draws heightened attention from traders watching whether the broader post-ATH consolidation holds or breaks down.
What makes the current price level particularly significant is the convergence of two technical indicators. Both the rising channel floor and the 0.382 Fibonacci retracement level sit near $63,500, transforming the area into a pivotal zone that could determine whether this represents a routine pullback or a broken trend.
Converging Support Levels at $63,500
On the 4-hour chart, Bitcoin sits at the intersection of two independent support levels. The rising lower edge of the channel runs near $63,500, while the 0.382 Fibonacci retracement sits at $63,517 — almost directly on top of it.
When two separate technical levels converge at the same price, traders typically defend that zone more aggressively than either line individually. A failure at such a confluence carries greater significance. A decisive 4-hour close below $63,500 would breach both the channel and the Fibonacci level simultaneously, producing a considerably stronger bearish signal than either giving way on its own.
Former Support Flips to Resistance
The price is currently boxed between the 0.236 retracement at $64,838 overhead and the 0.382 at $63,517 below. A large red candle on July 24 knocked Bitcoin out of the upper half of that range, and it has been drifting around $64,000 since.
For most of the past week, the 0.236 level functioned as a shelf that supported the price. That level has now flipped into resistance, which is why the short-term bias remains tilted to the downside. Buyers would need to reclaim $64,838 with conviction to shift the outlook, and until they do, every upward push encounters sellers at a level that previously provided support.
Momentum Indicators Signal Cooling, Not Reversal
The RSI on the 4-hour chart has declined to 37 on the fast line, with its signal line at 42.76. Both are rolling over from the highs printed during the July 21 push. A reading in the mid-30s indicates that selling pressure has increased and buyers have pulled back, though it has not entered the sub-30 zone that would typically flag an oversold snap-back. The current momentum picture suggests fading rather than a full reversal. Historically, if price holds the $63,500 confluence while RSI remains at these lows, that combination has preceded bounces.
Volume patterns support a measured interpretation. The slide from the highs occurred without a distribution spike, and no capitulation candle appeared at any point during the pullback. Quiet volume during a decline typically indicates holders trimming positions rather than rushing to sell. However, a break of the lower boundary accompanied by heavy volume would quickly alter that reading, making candle size as important as direction to monitor.
Funding Rate Suggests Leverage Is Not a Factor
The OI-weighted funding rate stands at 0.0019%, effectively flat. Positive funding means longs are paying shorts to maintain positions, and elevated readings typically signal a crowded, overheated market prone to sharp unwinds. At barely above zero, the current rate indicates Bitcoin is holding its channel without a large buildup of leveraged longs behind it — a contrast with earlier episodes in the cycle when funding spiked into double digits and preceded violent liquidation cascades.
According to data from CoinGlass, liquidations over the past 24 hours totaled $68.21 million and were predominantly long positions — a modest figure consistent with profit-taking rather than any leverage-driven blow-off.
Key Levels to Watch
The chart presents a clear binary scenario around $63,500.
If support breaks:
- The 0.5 retracement at $62,450 serves as the first downside target, representing the line between a healthy pullback and a more concerning one
- The 0.618 retracement at $61,382 follows; losing that level would cast doubt on the entire June-to-July advance
If support holds:
- Reclaiming the 0.236 at $64,838 is the first objective for buyers
- The $65,500 shelf sits above that
- A push back to the channel top and the $66,973 high completes the upside path
With funding flat and no volume spike accompanying the decline, there is no leverage-driven catalyst forcing the market's hand. The decision at $63,500 rests on spot supply and demand rather than a cascade of forced sellers, which would give any breakdown from current levels a different character than a squeeze-driven flush. The trigger for a bullish reversal remains fixed: a 4-hour close back above $64,838 would shift the market from a defensive posture back toward a push toward the channel top.

