XRP Holds Bullish Setup Above $1.13 Even as ETF Inflows Quietly Decelerate
Key Takeaways
- •XRP has been tracing a cup-and-handle pattern since early July, and declining sell-side volume during the current pullback suggests the consolidation is orderly rather than panic-driven.
- •Monthly XRP ETF inflows peaked at $131.94 million in May before falling to $59.46 million in June and just $12.43 million through July, marking the weakest monthly total since the products launched.
- •The Hodler Net Position Change metric has declined from approximately 231 million to 226 million XRP since July 19, a movement that has previously preceded price pullbacks.
- •A decisive daily close above $1.15 would confirm a breakout from the handle, potentially opening the path toward $1.18 and $1.21.
- •A drop below $1.05, which represents the cup low, would entirely invalidate the bullish pattern and expose deeper support levels.
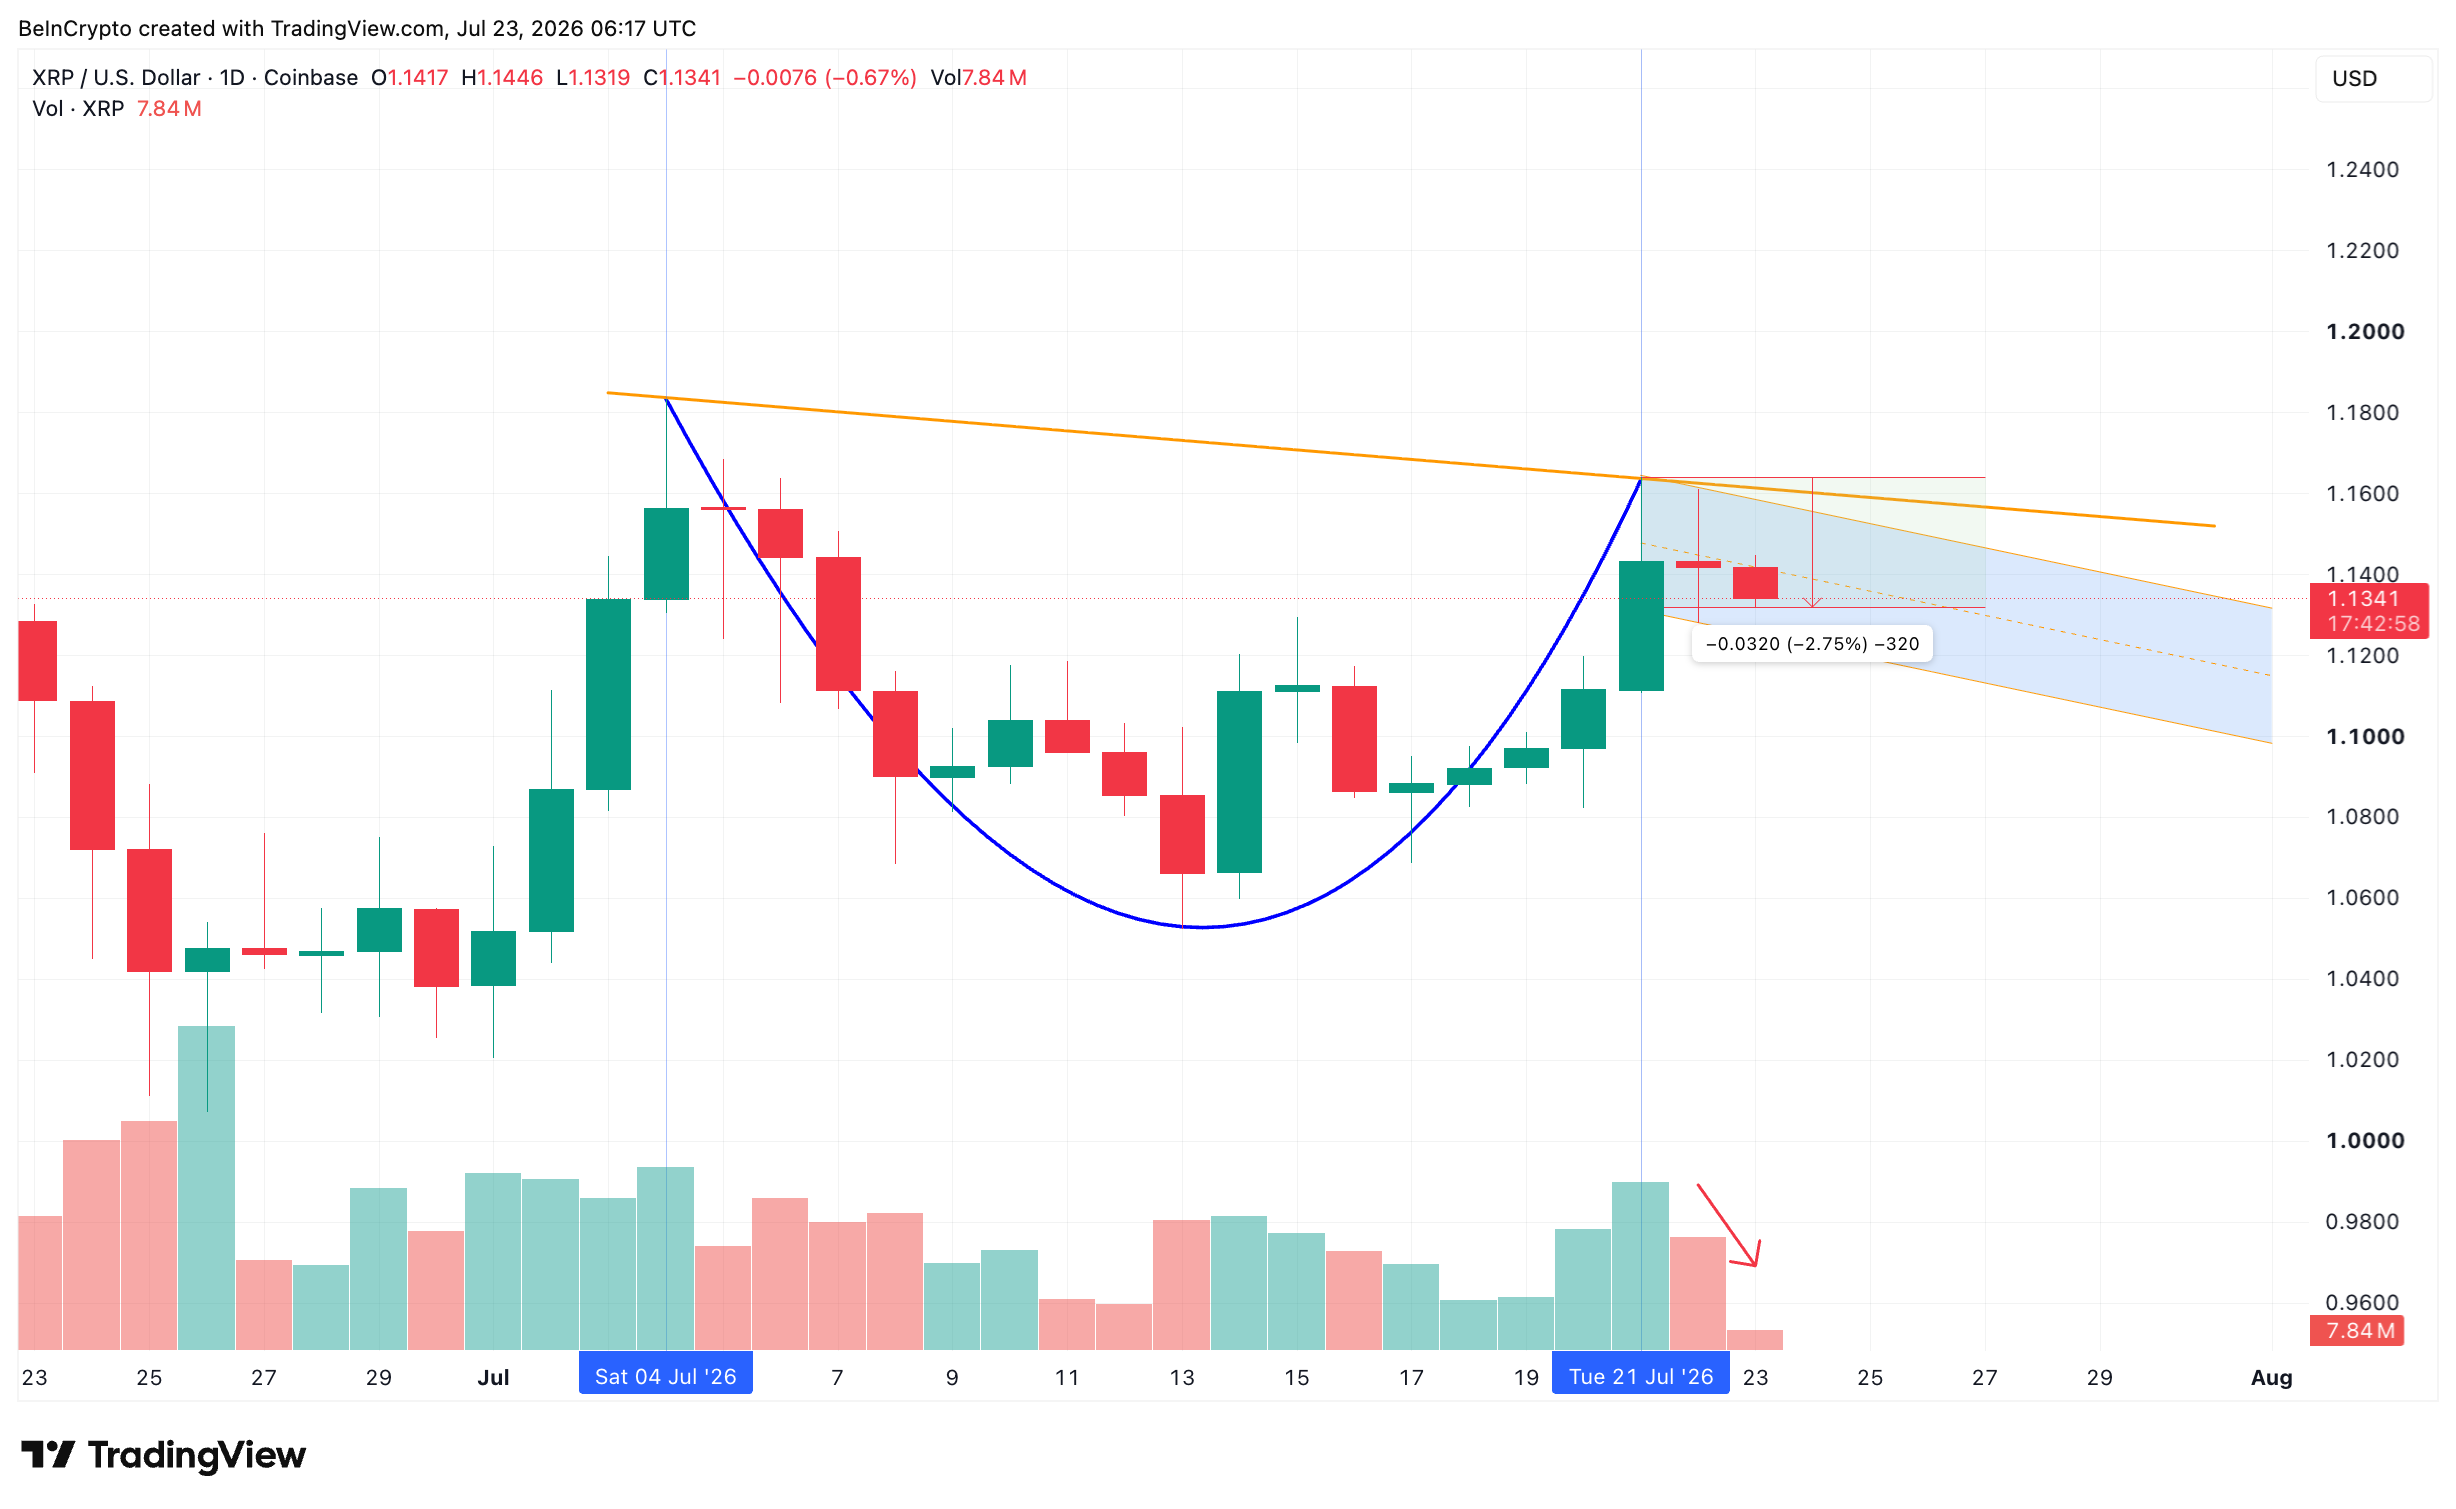
XRP is holding just above $1.13 following a modest pullback, maintaining a bullish chart structure even as institutional demand shows early signs of cooling.
The token has drifted lower since July 21, but the decline appears orderly rather than driven by panic selling. Beneath that calm, however, a growing tension has emerged between the technical picture and the capital flowing into XRP-linked investment products — products that only became possible after the SEC dropped its long-running case against Ripple earlier in 2025, clearing the path for spot XRP ETFs to follow the Bitcoin and Ethereum funds that preceded them.
Cup and Handle Pattern Takes Shape as Selling Pressure Eases
Since early July, XRP has been tracing a cup and handle formation — a rounded recovery followed by a slight downward drift that frequently precedes a breakout. The pattern, popularized by investor William O'Neil, is widely tracked by traders as a continuation signal within an existing uptrend. The ongoing consolidation that began on July 21 aligns neatly with the handle portion of the pattern.
A critical detail is that trading volume has thinned during the recent slide. Declining sell-side volume suggests the pullback represents a pause rather than a new wave of liquidations, which keeps the bullish breakout thesis intact.
Nevertheless, a favorable chart setup carries limited weight if the buyers underpinning it begin to withdraw.
XRP ETF Inflows Remain Positive but Trend Is Weakening
The flow data, however, contains a subtle cautionary signal. On the surface, XRP ETF inflows remain in positive territory, with fresh capital arriving every month since the products launched. At a glance, that would appear to indicate steady institutional interest.
A closer look at the pace of those inflows tells a different story. Monthly inflows rose from $81.59 million in April to a peak of $131.94 million in May, then dropped by more than half to $59.46 million in June. Through July so far, the funds have attracted just $12.43 million — the weakest monthly total on record. While the figures remain positive, the persistent decline suggests institutional buyers may be gradually pulling back, pointing to cooling XRP ETF demand. This kind of post-launch deceleration is not unique to XRP; Bitcoin and Ethereum spot ETFs similarly saw outsized early interest give way to steadier, more uneven inflows in the months following their debuts.
Fund flows represent only one dimension of the demand picture. On-chain holder behavior points to a similar quiet shift.
Hodler Net Position Change Signals a Familiar Pattern
The Hodler Net Position Change — a metric that tracks whether long-term holders are accumulating or reducing their positions — is flashing a recognizable signal. On June 22, the indicator registered one of its highest readings.
From that point, the metric declined steadily through July 1, and XRP price corrected in tandem, falling from $1.13 to $1.05 over that window.
As long-term holders resumed accumulation, the price recovered, and the two metrics have moved in close correlation since.
Since July 19, the metric has turned lower again, easing from approximately 231 million to roughly 226 million XRP. If the observed correlation holds, the price may follow suit.
That dynamic leaves the chart to settle the divergence.
Key XRP Price Levels to Monitor
With the current swing still developing, the critical levels derive from the July 1 to July 13 price movement. The first upside hurdle sits at $1.15, corresponding to the 0.618 Fibonacci retracement zone — a technical level that commonly marks a pullback point within a broader move.
A decisive break above $1.15 would break the handle and bring the cup neckline near $1.16 into focus. Beyond that, $1.18 and $1.21 come into play. However, XRP has a track record of failed cup formations, so a genuine breakout would require a firm daily close rather than a fleeting intraday wick.
On the downside, a drop below $1.13 would expose $1.12, followed by the $1.09 support level. A decline beneath $1.05 — the cup low — would invalidate the pattern entirely. For now, $1.15 marks the line separating a potential advance toward $1.21 from a retreat back to $1.09.
