Solana Holds Near $77 as ETF Inflows and Derivatives Positioning Improve
Key Takeaways
- •Spot Solana ETFs recorded $5.83 million in net inflows on Tuesday, the largest single-day figure since July 6 and the second consecutive day of positive flows.
- •Solana's long-to-short ratio in derivatives markets rose to 1.12 on Wednesday, approaching its highest level in more than a month.
- •SOL traded near $78.05, holding above its 50-day EMA at $76.76 but remaining below the 100-day EMA at $80.39 and the 200-day EMA at $92.87.
- •The RSI stood at approximately 54, indicating moderate upward momentum, while the MACD remained slightly below its neutral line.
- •Immediate resistance sits near the 50% Fibonacci retracement at $79.27, with a critical overhead level at the 100-day EMA of $80.39 that buyers have yet to overcome.
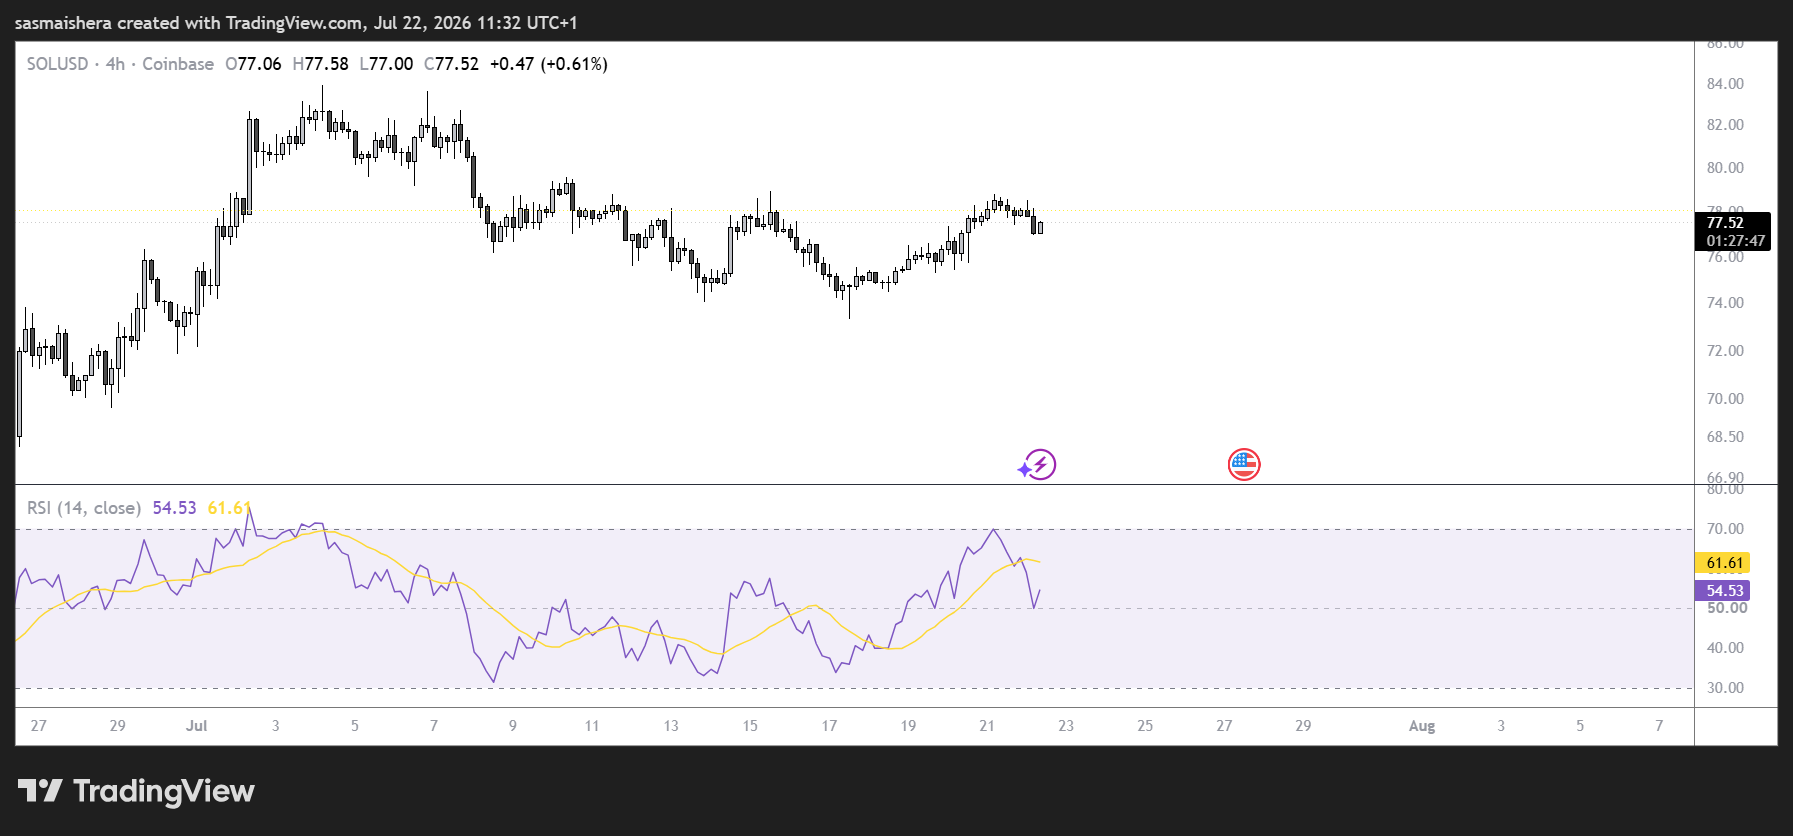
Solana (SOL) traded near $78 on Wednesday, holding around the $77 level and extending its weekly gain to more than 2% as institutional activity in spot Solana exchange-traded funds improved.
Recent inflows into spot Solana ETFs, together with stronger long positioning in derivatives markets, have supported the token’s near-term setup. However, SOL continued to face technical resistance that has limited further upside momentum.
Solana ETFs post strongest inflows since July 6
Institutional demand for Solana strengthened this week. According to SoSoValue, spot Solana ETFs recorded $5.83 million in net inflows on Tuesday, marking a second consecutive day of positive flows.
ETF flow data is closely watched because net inflows can reflect fresh capital entering regulated investment products tied to the underlying asset, while outflows can signal redemptions or reduced exposure. For SOL, the return of positive flows offers a clearer read on institutional participation after a quieter stretch for the products.
The figure was the largest single-day inflow since July 6, following a quieter period for the products. Continued inflows during the week could add buying pressure and help support a broader recovery in SOL’s price.
Derivatives data also showed increased long positioning. According to CoinGlass, Solana’s long-to-short ratio rose to 1.12 on Wednesday, moving close to its highest level in more than a month.
A higher long-to-short ratio indicates that leveraged traders are positioning more heavily for price gains than declines. The increase in long exposure came alongside the improvement in ETF flows, showing firmer participation from both institutional vehicles and derivatives traders.
Because derivatives positions often use leverage, changes in long-to-short ratios can also make nearby support and resistance levels more important for traders monitoring liquidation risk. That makes SOL’s reaction around the $77 to $80 area a key short-term gauge of whether the recent positioning shift is being absorbed by the market.
SOL price remains below key moving averages
From a technical perspective, Solana continued to consolidate after moving back above its 50-day Exponential Moving Average (EMA). SOL was trading near $78.05, above the 50-day EMA at $76.76 and above horizontal support around $77.06.
Those levels remain important support for the current recovery attempt. Still, the token stayed below the 100-day EMA at $80.39 and well below the 200-day EMA at $92.87. Until those moving-average resistance levels are reclaimed, the broader technical picture remains cautious.
Momentum indicators were mixed. The Relative Strength Index (RSI) was around 54, indicating moderate upward momentum without entering overbought territory.
The Moving Average Convergence Divergence (MACD), meanwhile, remained slightly below the neutral line. That suggests buyers have gained some traction, but SOL has not yet established a decisive uptrend.
The first resistance level is near the 50% Fibonacci retracement at about $79.27. The next major level is the 100-day EMA at $80.39.
A sustained daily close above that resistance area would improve the technical outlook and could allow SOL to move toward the 61.8% Fibonacci retracement at $83.78.
On the downside, immediate support remains at $77.06, with additional support from the 50-day EMA at $76.76. A break below that range could expose SOL to a decline toward the 38.2% Fibonacci retracement at $74.75.
If selling pressure increases further, additional support levels are located at $69.16 and $60.13. Those levels are likely to become relevant only if sellers regain stronger control of the broader trend.
For now, positive ETF flows, a higher long-to-short ratio in derivatives markets, and SOL’s ability to hold above nearby support keep attention on whether buyers can push the token above the key $80.39 resistance level.
