Solana Approaches $80 as ETF Inflows Rise, but $84 Remains Key Test
Key Takeaways
- •SOL has recovered from its June low near $60 but continues to trade within a defined $73 to $84 range.
- •Solana spot ETFs posted $8.47 million in net inflows across July 20 and July 21, exceeding the prior three positive weekly readings combined.
- •A daily close above the 100-day simple moving average at $79 would improve the short-term setup, while a move above $84 with stronger volume would confirm a higher high.
- •The $73 level remains key support because it aligns with both the range floor and the rising 50-day simple moving average.
- •Solana’s Alpenglow consensus upgrade is scheduled for mainnet between August and October 2026, pending the Agave 4.2 client release and validator key registrations.
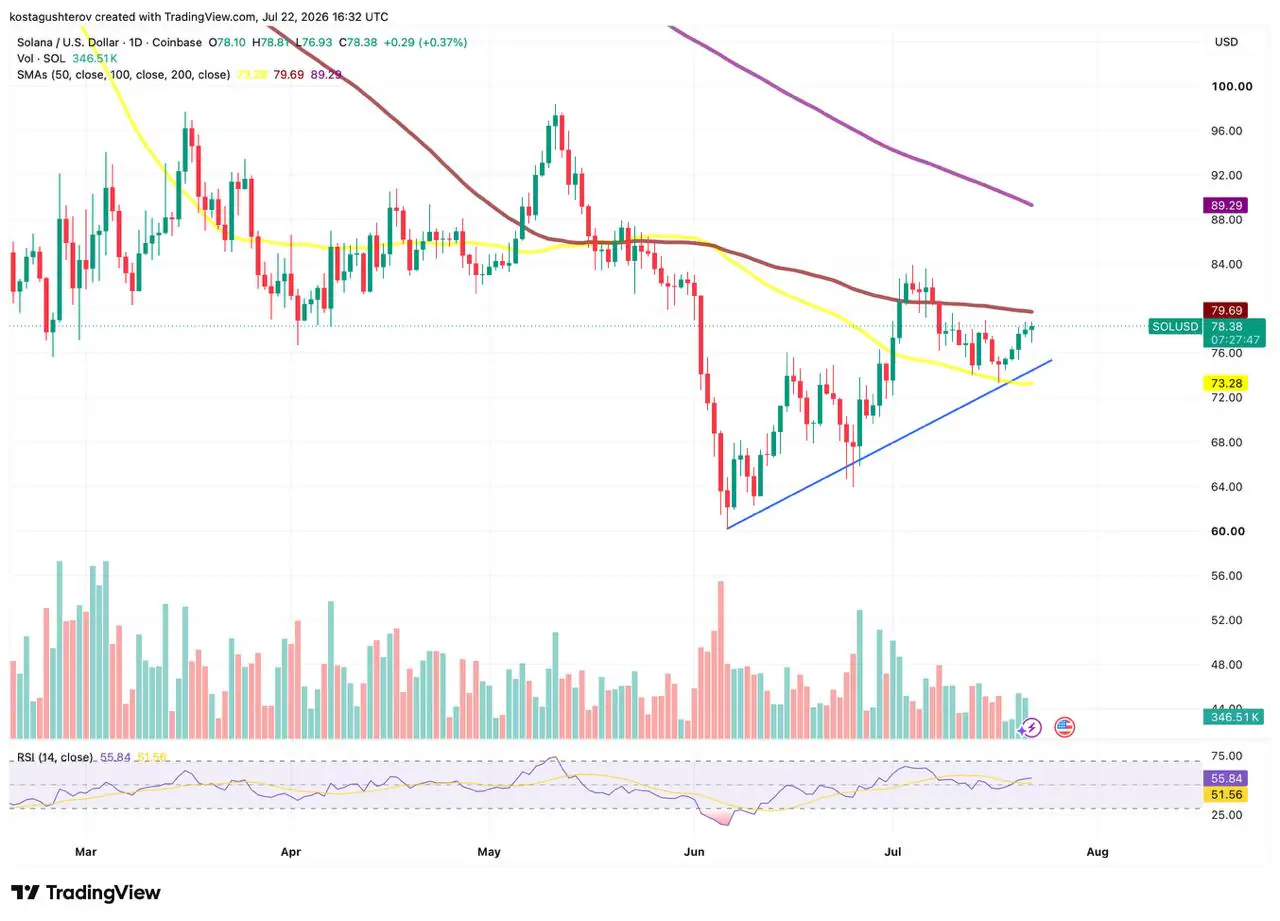
Solana, one of the largest Layer 1 smart contract platforms by market capitalization, has recovered significantly from its June low near $60, but SOL remains confined within the $73 to $84 trading range that has governed price action since the crash. The token is also trading just below its flat 100-day simple moving average at $79, placing it directly under the first major resistance level in the current structure.
At the same time, Solana spot ETFs have posted four consecutive weeks of positive readings. That has created a more supportive flow backdrop, although the chart has not yet confirmed a breakout.
Solana ETF Inflows Accelerate
The latest four-week sequence shows uninterrupted net inflows into Solana spot ETFs, but the scale of those inflows has shifted notably.
The most recent total of $8.47 million came from $2.64 million on July 20 and $5.83 million on July 21, according to SoSoValue data. Those two days alone exceeded the roughly $7.63 million recorded across the previous three positive weekly readings combined.
Spot crypto ETFs allow investors to gain exposure to digital assets through traditional brokerage accounts without directly holding the underlying tokens. The category gained prominence after US-listed Bitcoin spot ETFs launched in January 2024, followed by Ethereum spot ETFs later that year. Solana spot ETFs are a more recent addition, and their inflow trends are watched as an indicator of institutional and traditional-finance interest separate from on-chain activity.
The concentration of demand in the latest period strengthens the flow signal. However, ETF inflows do not by themselves resolve Solana's price structure. SOL remains below the resistance levels that have repeatedly capped the recovery, meaning the data supports the current base without confirming a sustained breakout.
June Decline Gives Way to a Defined Range
The June sell-off pushed Solana toward $60 before buyers established a recovery. Since then, the price has formed a series of higher lows, but stronger advances have continued to stall beneath the upper end of the current range.
That has left SOL in a sideways consolidation between approximately $73 and $84. The rising 50-day simple moving average at $73 now overlaps with the lower boundary of that range, giving the floor both horizontal and moving-average support.
SOL is currently positioned near the middle of the structure rather than near either extreme. That reduces the significance of smaller daily moves around $78, because the price is neither breaking resistance nor threatening the established base.
The flat 100-day moving average reinforces the neutral technical reading. Its position directly above the market indicates that the earlier downtrend has lost some momentum, but it has not yet been replaced by a confirmed uptrend.
$79 Is the First Hurdle, While $84 Is the Confirmation Level
The first test for SOL is the 100-day simple moving average at $79. A daily close above that level would move the token out of the middle of the range and reopen a path toward $84, where the recovery stalled around mid-July.
Reclaiming $79 would improve the short-term structure, but the more important confirmation remains at the range ceiling. A move above $84 with stronger volume would create the first higher high since May.
Such a move would alter the character of the recovery. Rather than continuing to rotate between established support and resistance, SOL would begin to break the sequence that has kept it under pressure since the earlier highs.
The falling 200-day simple moving average at $89 would then become the next visible obstacle. That level would test whether the market can extend beyond a range breakout into a broader trend reversal.
The relative strength index is near 55, leaving room for price movement in either direction. Momentum is neither overbought nor deeply weakened, so the outcome is likely to depend more on SOL's reaction at the 100-day moving average and at $84 than on an extreme indicator reading.
The $73 Floor Remains Central to the Recovery
The $73 area combines the range floor with the rising 50-day moving average, making it the level that protects the recovery from reverting toward its June structure.
A rejection below the 100-day moving average would initially keep SOL trapped inside the range. The price could rotate back toward $73 without invalidating the base, provided buyers continue to defend that area.
A daily close below $73 would carry greater technical significance. It would break both horizontal support and the moving average that has risen beneath the price during the recovery.
Such a loss would expose the lower recovery zone near $66, followed by the June base around $60. A return to those levels would indicate that the recent consolidation had failed to establish a durable floor.
Alpenglow Adds Another Potential Catalyst
Solana is approaching the expected activation window for its Alpenglow consensus upgrade, scheduled for mainnet between August and October 2026.
The timing remains dependent on the release of the Agave 4.2 client and sufficient validator key registrations to complete the required testing and security audits.
Alpenglow represents a complete overhaul of Solana's consensus layer, replacing Proof of History and Tower BFT. Proof of History is the timestamping mechanism that orders transactions before they enter the consensus process, while Tower BFT is the protocol that finalizes blocks. Replacing both components would mark one of the most significant architectural changes since Solana's mainnet launch, and it is designed to substantially reduce transaction finality times.
The approaching upgrade could draw additional market attention at a time when ETF inflows are strengthening. Solana has positioned itself as a high-throughput network for decentralized finance, payments, and consumer applications, and improvements to finality could be relevant to developers evaluating the chain for latency-sensitive use cases.
However, the upgrade would not confirm that the current range has ended while SOL remains below $79 and $84. A stronger technical response would require continued ETF demand, a reclaim of the 100-day moving average and enough volume to clear the July ceiling. Without that combination, Alpenglow may add to the broader narrative around Solana while price action remains sideways.
Price Structure Still Leads the Outlook
Solana's backdrop has become more constructive, with ETF demand strengthening and Alpenglow providing a potential catalyst. Even so, the price has not yet followed with the same conviction, and the chart remains capped beneath its main resistance levels.
The structure therefore remains neutral until the range resolves. Buyers have defended the recovery so far, but only a confirmed move through the upper boundary would turn the consolidation into a more durable advance.
This article is provided for informational purposes only and does not constitute financial, investment or legal advice.

