Ethereum Builder Activity and Leverage Metrics Converge as ETH Trades Near $1,900
Key Takeaways
- •Ethereum smart contract deployments have risen 192% above the 90-day baseline, with nearly 57% of the increase occurring in the past week.
- •Stablecoin net flows into Binance are nearly 370% above their three-month average, with daily inflows averaging more than $58 million.
- •Binance funding rates are about 220% above their 90-day norm, indicating leveraged traders are positioned long.
- •Ethereum staking has reached a record 33.58%, while median transaction fees are down more than 96% over three months.
- •CryptoQuant said the combined signals point to potential volatility rather than a straightforward accumulation pattern.
New Ethereum smart contract deployments have risen 192% above their 90-day baseline, while funding rates are running 220% above their 90-day norm, according to a CryptoQuant QuickTake published by analyst CryptoOnchain. The combination is notable because, according to the analysis, these signals have rarely appeared together without preceding a significant directional move.
The central question raised by the data is whether the leverage now building in derivatives markets is anticipating the increase in developer activity or merely responding to it.
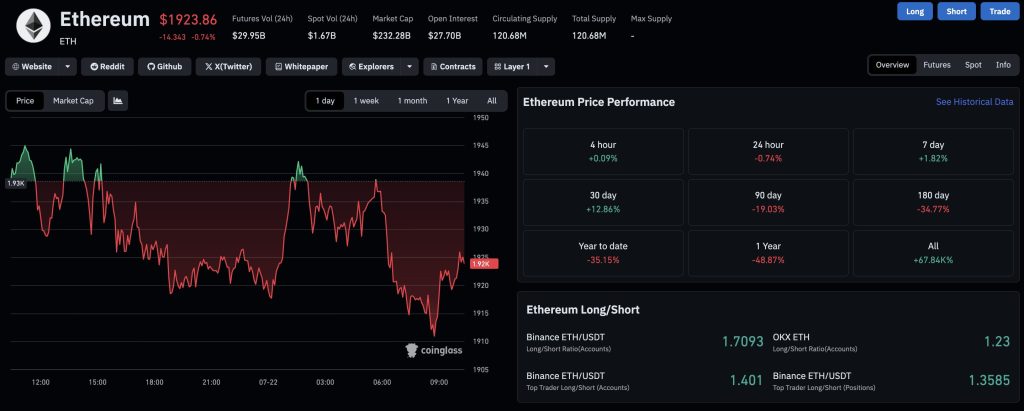
ETH has moved unevenly from roughly $1,770 to $1,903 over the past two weeks. On the surface, the price action appears relatively ordinary, but beneath it, three separate signals are becoming active at the same time: builder activity, exchange-based stablecoin positioning, and derivatives leverage.
TOM LEE: ETHEREUM HAS MORE DEVELOPERS THAN EVERY OTHER CHAIN COMBINED Unlike the 2022 bear market, the builder base keeps growing, and that's the tell: – Nearly 6,000 developers work on the EVM stack, more than all other chains on the table combined – Per Electric Capital,… pic.twitter.com/KgJCy65hiF — Tom Lee Tracker (Not actually Tom) (@TomLeeTracker) July 20, 2026
TOM LEE: ETHEREUM HAS MORE DEVELOPERS THAN EVERY OTHER CHAIN COMBINED Unlike the 2022 bear market, the builder base keeps growing, and that's the tell: – Nearly 6,000 developers work on the EVM stack, more than all other chains on the table combined – Per Electric Capital,… pic.twitter.com/KgJCy65hiF
Builder Activity Rises as Stablecoins Move Into Binance
The most prominent signal in CryptoOnchain’s CryptoQuant analysis is the developer activity reading. Smart contract deployments on Ethereum have increased about 192% compared with the 90-day baseline, and nearly 57% of that increase occurred within the past week.
Deployment spikes of this size are generally associated with new protocol launches, redeployed contracts before a release, or coordinated testing cycles. In that context, the data points to builder activity rather than only speculative market noise. For Ethereum, contract deployment is a useful activity gauge because decentralized applications, token systems, infrastructure tools, and protocol upgrades are implemented through smart contracts rather than through a single company-controlled release cycle.
At the same time, stablecoin net flows into Binance have climbed to nearly 370% above their three-month average, with daily inflows averaging more than $58 million. Capital moving onto an exchange instead of being deployed directly on-chain is commonly viewed as pre-trade positioning. It indicates preparation, while not confirming the eventual direction of trading activity.
The complication is that these two signals, which often appear sequentially during a clearer accumulation phase, are now appearing alongside an already active derivatives market. That makes the setup less straightforward than a slow accumulation period marked by subdued funding.
Funding Rates Show Leveraged Long Positioning
Funding rates on Binance are approximately 220% above their 90-day norm. The reading indicates that leveraged traders are already positioned long and are paying to maintain those positions.
For traders tracking perpetual futures dynamics, elevated funding at this level has historically preceded either a leverage flush that resets overextended positioning or price follow-through that validates the leveraged trade. Funding is closely watched because perpetual futures do not have an expiry date, so periodic payments between long and short traders help keep contract prices aligned with spot markets.
CryptoOnchain’s analysis notes that the simultaneous presence of stablecoin staging and high funding rates does not represent a clean accumulation pattern. Instead, such conditions have historically been associated with more volatile, two-sided price action rather than a simple directional trend.
Open interest rising while funding is elevated, and while price has not yet broken out cleanly, can create the conditions for sharp movement in either direction.
The on-chain metrics that would typically support a constructive reading remain significant. Staking has climbed to a fresh all-time high of 33.58%, reducing the liquid float. Median transaction fees are down by more than 96% compared with three months ago, a change the source attributes not to network abandonment but to Ethereum’s post-Dencun structure.
These readings define the current valuation gap described in the analysis: base-layer economics remain subdued, with median transaction fees down more than 96% over three months, while staking continues to rise to a record 33.58%. The gap between Ethereum’s on-chain metrics and ETH price performance has drawn institutional attention at current levels, according to the source.
Three Signals Become Active at the Same Time
$ETH is going sideways. But spot demand is going up. This looks like another accumulation before expansion. pic.twitter.com/Z2lwuH9zik — Ted (@TedPillows) July 22, 2026
$ETH is going sideways. But spot demand is going up. This looks like another accumulation before expansion. pic.twitter.com/Z2lwuH9zik
CryptoQuant’s analysis highlights a rare convergence of three signals: elevated builder activity, stablecoin capital staging on exchanges, and existing leverage through derivatives. Each has independent significance, but their simultaneous appearance without a clear price catalyst is the core focus of the report.
Ethereum’s post-Dencun architecture has contributed to lower fees, as Layer 2 activity has shifted execution costs away from the mainnet while maintaining economic security and validator staking yield, according to the source. Developer activity also remains elevated, with the 192% deployment increase suggesting continued resilience even during market downturns.
Institutional flows, as described in the source, point to cautious short-term behavior, while cumulative inflows since the launch of the ETH ETF still show demand. That context is relevant to the question of whether the leverage bid is mainly retail speculation or early institutional accumulation.
According to CryptoQuant, the setup may resolve through funding rates cooling as leveraged longs are flushed out, or through a price breakthrough that validates the leverage position. Which signal ultimately dominates — builder activity, exchange-based capital, or derivatives positioning — will become clear only as market conditions develop. Until then, the three-signal convergence remains the central point of attention.
