Analyst Says Solana Looks More Vulnerable Than Bitcoin Despite Recent Rebound
Key Takeaways
- •Bitcoin trades at approximately $65,711, about 47.88% below its all-time high of $126,080 reached in October 2025, while Solana hovers near $77.99, roughly 73.41% below its January 2025 peak of $293.31.
- •A More Crypto Online analyst interprets the recent rebounds as three-wave corrective moves under Elliott Wave Theory rather than the five-wave impulses that would signal a new bullish trend for either asset.
- •Solana continues to underperform Bitcoin based on the SOL/BTC ratio, and the analyst expects SOL to remain more vulnerable if another market decline develops.
- •Key technical levels for Solana include resistance near $89.27, $94, and $98.50, with primary support around $74 and downside targets near $48.80 and $43.22 if key support fails.
- •Six consecutive days of spot Bitcoin ETF inflows recently helped push BTC above $66,000, reflecting renewed institutional demand that is widely tracked as a driver of short-term price action.
Bitcoin and Solana have both rebounded from their June lows, but the recovery has not persuaded every market analyst that the broader decline has ended. Recent gains have improved short-term conditions, while one technical analyst says the latest moves still look more like temporary corrective rebounds than the start of a new bull-market phase.
The comparison becomes more notable when Bitcoin and Solana are assessed side by side. In a recent analysis on the More Crypto Online YouTube channel, the analyst argued that one of the two assets continues to appear weaker. The analyst also identified several price levels that may help determine whether the current recovery extends or loses momentum.
Bitcoin Recovers, but Major Resistance Remains
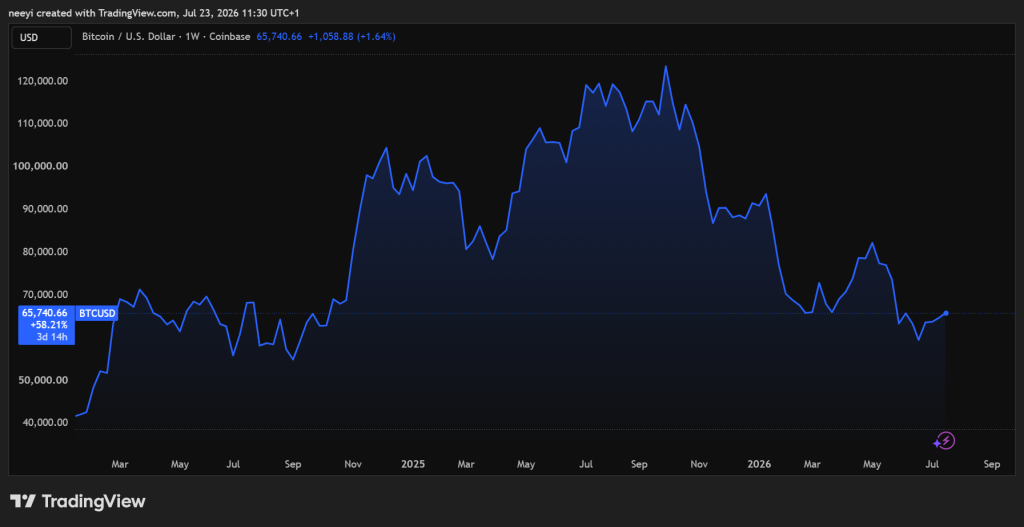
Bitcoin is trading at $65,711, leaving BTC about 47.88% below its all-time high of $126,080, which it reached on October 6, 2025.
The period after that record high included several sharp market moves. Bitcoin fell to $84,648 in November before ending 2025 near $92,119. In early 2026, BTC rallied again, reaching $97,963 in January before heavy selling pushed the price down to $60,001 in February.
March brought an extended consolidation phase, with Bitcoin trading between roughly $67,000 and $75,000. Buyers repeatedly defended the $62,000 to $65,000 area. April and May then produced another recovery above $80,000, but that strength faded after macroeconomic pressure returned and large spot Bitcoin ETF outflows emerged during June.
More recent trading has appeared more stable. Six consecutive days of spot ETF inflows helped Bitcoin move above $66,000 before the market settled back into a consolidation range between roughly $62,500 and $65,500. Those ETF flows are widely tracked as an indicator of institutional demand, making them a frequently cited driver of short-term Bitcoin price action.
Solana Rebounds but Remains Far Below Its Prior High
Solana is trading near $77.99, leaving SOL about 73.41% below its all-time high of $293.31, recorded on January 19, 2025.
The recovery from that peak has been uneven. Solana lost substantial value after the January 2025 high, as profit-taking, network security concerns and broader crypto market weakness eventually drove the token to a major low before the ecosystem began to stabilize.
Early 2026 brought another sequence of volatile moves. January saw a brief recovery before macro uncertainty pressured the market in February. March and April produced steadier trading as blockchain activity improved through meme coin activity and tokenized stock projects.
June marked another weak period for SOL after bearish market conditions pushed the asset to its lowest level of the year. July has been stronger. Higher decentralized exchange volumes and the Pump.fun automated supply burn buyback program helped Solana rebound into the $74 to $83 area, where it continues to trade. Pump.fun is a meme coin launch platform built on Solana that has become a significant source of on-chain transaction volume for the network.
More Crypto Online Says Both Assets Still Show Bearish Structures
The More Crypto Online analyst said Bitcoin and Solana remain within broader downtrends despite their recent rebounds.
According to the analysis, the rally from the June lows resembles a classic three-wave corrective move rather than a stronger impulse that would typically signal the start of a new bullish trend. That interpretation draws on Elliott Wave Theory, a technical framework that classifies market moves as either five-wave impulses in the direction of the primary trend or three-wave corrections against it. Because of that structure, the analyst said there is not yet enough evidence to confirm that either Bitcoin or Solana has formed a major market bottom.
Resistance was another focus of the analysis. Solana has not yet broken above the first important resistance zone near $98.50. Until that level is cleared, the analyst said buyers have not taken clear control of the market.
The analyst also noted that Bitcoin appears to be forming a similar corrective structure. Because the two assets remain highly correlated, another rejection in BTC could also pull SOL lower, according to the analysis.
Solana Levels to Watch if Support Fails
The More Crypto Online analyst outlined several Solana price levels to monitor in the coming days.
Key levels cited in the analysis include:
- Resistance near $89.27, $94 and $98.50.
- Primary support around $74.
- A break below $64.30, which the analyst said could confirm another bearish wave.
- Additional downside targets near $48.80 and $43.22.
The analyst emphasized that the current bounce still appears corrective. Under that view, Solana may still climb toward resistance before another decline begins.
A stronger bullish case would require a different structure. The analyst said a clear five-wave advance would provide stronger evidence that a lasting bottom has formed.
SOL/BTC Chart Still Shows Solana Underperforming Bitcoin
The comparison between Solana and Bitcoin was one of the main conclusions of the analysis.
Based on the SOL/BTC chart, the analyst said Solana continues to underperform Bitcoin in the larger trend. The SOL/BTC ratio measures SOL's value relative to Bitcoin rather than against the dollar, making it a tool for assessing relative strength between the two assets independent of fiat price movements. Recent gains have improved short-term performance, but the broader structure still points lower, according to the analysis.
The analyst said Solana briefly outperformed Bitcoin after the June lows, but that move also unfolded as another three-wave advance. For that reason, the chart does not confirm that Solana has begun a sustained period of outperformance against Bitcoin.
The analysis said a genuine trend reversal would require a clean five-wave advance from the June low. Until that appears, the analyst expects Solana to remain more vulnerable than Bitcoin if another market decline develops.
Additional Context
Bitcoin and Solana use different network designs. Both networks use proof-of-stake in some form, while Solana combines proof-of-stake with proof-of-history to order transactions chronologically. Ethereum also uses probabilistic finality and typically confirms transactions within minutes, while Solana achieves practical finality in under a second.
Over the past decade, Bitcoin has returned roughly 40% to 60% a year on average, outpacing the S&P 500 and gold over the same period, while also experiencing drawdowns those assets do not typically see. Bitcoin has also been written off many times during its history.
