Inside CoinGecko's 2026 Q2 Crypto Industry Report
Key Takeaways
- •Total crypto market capitalization declined by $304.8 billion in Q2 2026, ending the quarter at $2.1 trillion.
- •Stablecoin market capitalization fell 1.6% to $305.1 billion, marking its first quarterly contraction since Q3 2023.
- •Prediction market notional volume rose 48.7% quarter over quarter to $113.8 billion, with June reaching a record $52.8 billion.
- •Collector Crypt became the leading tokenized collectibles platform in June 2026 with a 62.8% volume share after monthly volume rose to $406 million.
- •Top centralized exchanges saw spot trading volume drop 27.9% to $1.95 trillion, while perpetuals volume declined 10.0% to $12.7 trillion.
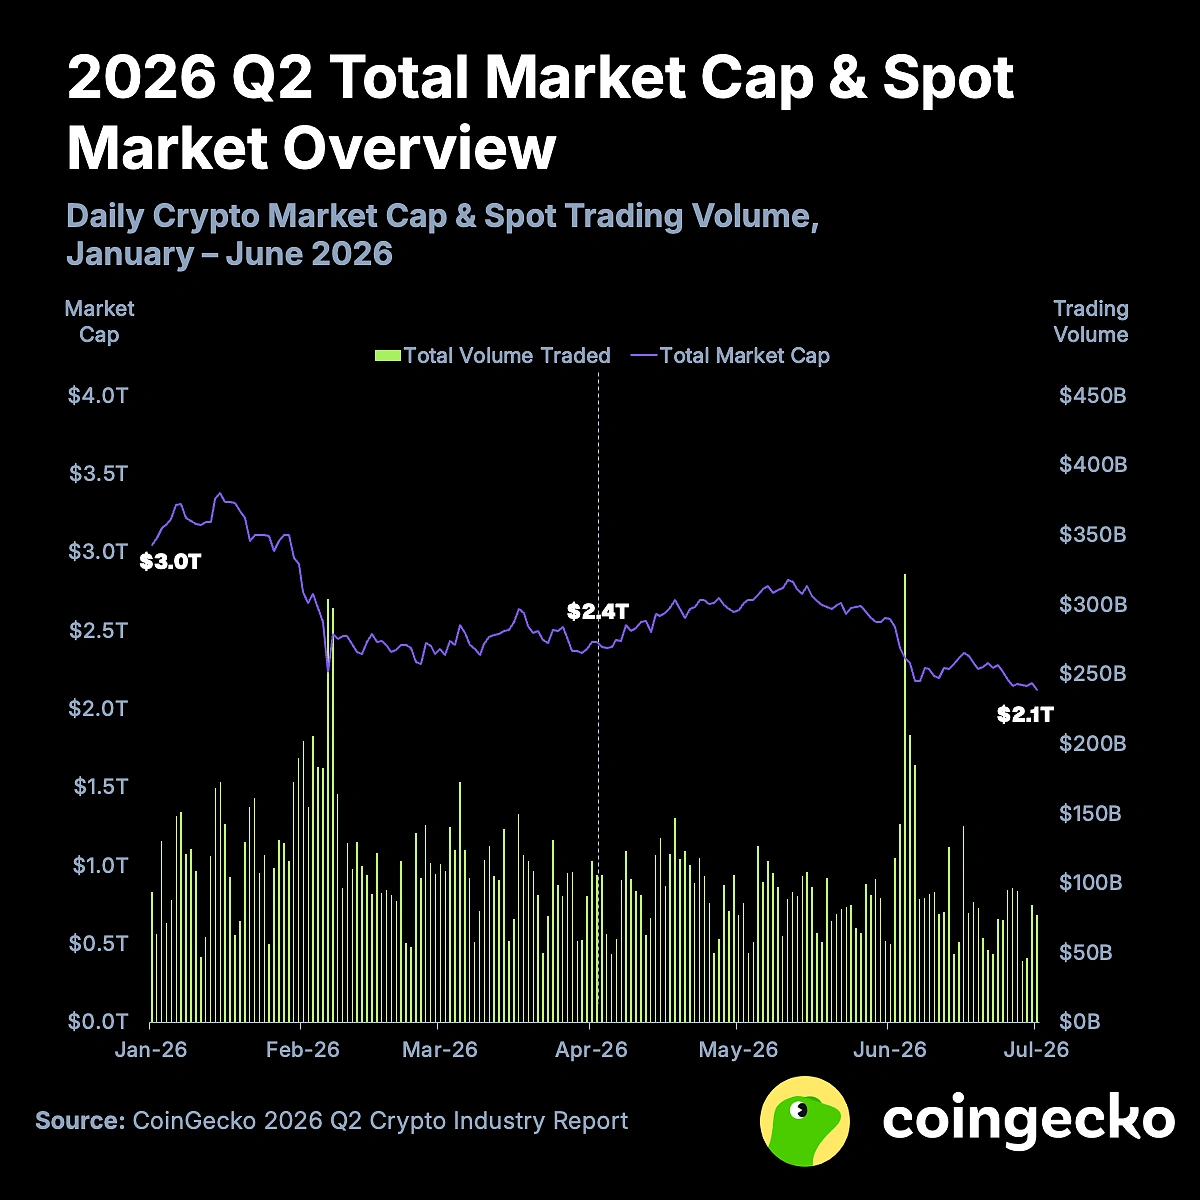
The cryptocurrency market extended its decline into a third consecutive quarter during 2026 Q2, with bearish momentum intensifying through a severe June sell-off. Total crypto market capitalization dropped 12.6%, losing $304.8 billion to close the quarter at $2.1 trillion — its lowest level since September 2024 and approximately 52% below the October 2025 peak. June delivered the quarter's sharpest correction, driven by a hawkish Federal Reserve posture that typically pressures speculative assets by keeping borrowing costs elevated, fluctuating US-Iran tensions, and a symbolic Bitcoin sale by Strategy, collectively producing the steepest decline of the year.
Bitcoin (-14.2%) and Ethereum (-25.4%) continued to underperform even as US equities mounted a robust recovery. The quarter was marked by a pronounced decoupling from traditional risk assets and an emerging bifurcation between struggling major cryptocurrencies and pockets of speculative altcoin demand. Most notably, Hyperliquid's HYPE token broke into the top 10, buoyed by new ETFs, prediction markets, and a landmark Coinbase deal.
CoinGecko's comprehensive 2026 Q2 Crypto Industry Report covers the broader crypto market landscape, provides detailed analysis of Bitcoin and Ethereum, explores the decentralized finance ecosystem, and reviews the performance of both centralized exchanges (CEX) and decentralized exchanges (DEX).
Key Takeaways
- Total crypto market cap fell 12.6% in 2026 Q2, ending June at $2.1T.
- Stablecoin market cap slipped 1.6% to $305.1B — a first since 2023 Q3.
- Notional volume on prediction markets grew 48.7% QoQ, totaling $113.8B in 2026 Q2.
- Collector Crypt monopolized the tokenized collectibles space with a 62.8% share in June 2026.
- Spot trading volume on centralized exchanges fell 27.9% in 2026 Q2 to $1.95T, with May hitting a new monthly low of $0.62T.
- Perpetuals trading volume on centralized exchanges fell 10.0% from $14.1T in Q1 to $12.7T in Q2.
1. Total Crypto Market Cap Fell 12.6% in 2026 Q2, Ending June at $2.1T
Total crypto market cap contracted from $2.4 trillion to $2.1 trillion during 2026 Q2. Unlike Q1's front-loaded sell-off, the second quarter began on more stable footing, with April ranking among the year's strongest months before momentum reversed. Asset price declines were accompanied by a contraction in stablecoin market cap — the first such simultaneous drop since 2023 Q3 — signaling capital withdrawal from the industry. Three consecutive quarters of decline mark the longest sustained drawdown since the 2022 bear market, placing current conditions in a historically rare territory for the asset class.
The quarter's most severe correction came in June, amid rising ETF outflows, a hawkish Fed stance, fluctuating US-Iran tensions, and a symbolic Bitcoin sale by Strategy. By quarter-end, total market cap sat roughly 52% below the October 2025 peak.
Trading activity cooled for a second consecutive quarter, with average daily trading volume declining 20.9% QoQ to $93.1 billion.
2. Stablecoin Market Cap Slipped 1.6% to $305.1B, a First Since 2023 Q3
The total stablecoin sector shed $4.8 billion (-1.6%) in 2026 Q2, closing at $305.1 billion. This reversed the marginal growth recorded in Q1, though the decline was modest relative to the broader market's pullback. Stablecoin supply is widely tracked as a gauge of sidelined capital available for deployment into crypto markets, making a quarterly contraction — alongside broader price declines — a meaningful signal that funds are leaving the ecosystem rather than waiting on the sidelines.
Circle's USDC posted the sector's largest absolute outflow, declining 4.8% (-$3.7 billion) to $73.5 billion. Tether's USDT, by contrast, held roughly steady at $184.4 billion with a 0.2% gain (+$0.3 billion), recovering from its Q1 outflow and raising its market share to 60%.
Sky's USDS reversed its prior quarter's momentum sharply, falling 16.4% (-$2.0 billion) to $10.0 billion. Ethena's USDe resumed its contraction after brief stabilization in Q1, dropping 24.4% (-$1.4 billion) to $4.4 billion. The decline was primarily driven by yield compression falling below the risk-free rate, which prompted sUSDS and sUSDe stakers to unstake.
WLFI's USD1 continued to grow, adding 5.5% (+$0.2 billion) at a more moderate pace than its Q1 surge. The "Others" category saw a modest rebound of 6.2% (+$1.7 billion).
3. Notional Volume on Prediction Markets Grew 48.7% QoQ, Totaling $113.8B in 2026 Q2
Notional volume on prediction markets reached $113.8 billion in 2026 Q2, representing 48.7% QoQ growth. June alone accounted for $52.8 billion in notional volume — a 91.9% surge above the previous five months' average of $27.5 billion and a new all-time high. This surge was driven by a concentration of major sporting events from late May onward, including the UEFA Champions League Final, Stanley Cup, NBA Finals, FIFA World Cup, and Wimbledon. That prediction markets posted record volume during the same quarter the broader crypto market contracted highlights a structural demand category that is attracting activity independent of cryptocurrency price trends.
The growth was most evident on Polymarket, where Sports contracts came to dominate volumes, rising from 40% in January to 81% in June. In terms of overall market share, Kalshi expanded its lead from 42.4% in Q1 to 58.9% in Q2, while Polymarket's share declined from 35.8% to 30.2% QoQ.
Rothera, the joint venture between Robinhood and Susquehanna International Group (SIG) launched in May, climbed rapidly to fourth place in June with $2.1 billion in notional volume.
4. Collector Crypt Monopolized the Tokenized Collectibles Space With a 62.8% Share in June 2026
Courtyard had largely dominated the tokenized TCG space during the first half of 2025, but Collector Crypt has now overtaken it as the leading platform in 2026. Collector Crypt recorded a 317.0% surge in monthly volume, growing from $97 million in January 2026 to $406 million in June 2026, and now commands a 62.8% volume share.
By comparison, OpenSea recorded only $32.7 million in NFT sales in June 2026, placing Collector Crypt, Courtyard, and Phygitals as the largest NFT marketplaces by volume. The disparity underscores how the center of gravity in NFT trading has shifted away from traditional art and profile-picture collectibles toward tokenized physical trading card games and gamified issuance models.
Notably, the majority of these platforms' volumes do not originate from secondary sales but from "gacha" mechanisms. On average, over 98% of a platform's transaction volume is generated through this feature, which allows users to purchase randomized NFTs across different tiers, each carrying a probability of yielding rare cards.
5. Spot Trading Volume on Centralized Exchanges Fell 27.9% in 2026 Q2 to $1.95T
The top 10 spot centralized exchanges recorded $1.95 trillion in combined trading volume during 2026 Q2, a 27.9% decrease from $2.70 trillion in Q1. Volumes fell to a monthly low of $619.0 billion in May before a modest recovery to $695.0 billion in June.
Despite the bear market, Binance extended its dominance with a 38.7% market share in Q2. Bybit (10.0%) was the only other exchange to maintain a double-digit share, having displaced MEXC.
Declines were broad but uneven, ranging from -5% to -56%. MEXC experienced the largest slump, with volume more than halving from $275.2 billion to $121.2 billion, causing its ranking to fall from #2 to #7. Crypto.com and KuCoin also posted significant drops of -40.9% and -38.5%, respectively.
6. Perpetuals Trading Volume on Centralized Exchanges Fell 10.0% From $14.1T in Q1 to $12.7T in Q2
The top 10 perpetual centralized exchanges recorded $12.7 trillion in combined volume during 2026 Q2, down 10.0% from $14.1 trillion in Q1. Despite the overall decline, monthly trading volume remained above $4.0 trillion, still exceeding the averages recorded during the first three quarters of 2024.
Perpetuals trading volume contracted less than spot on a quarter-over-quarter basis (-10.0% vs -39.1%), reflecting traders' continued preference for perps speculation. The growth of real-world asset (RWA) perps also helped sustain interest.
Trading volume trends foreshadowed broader market weakness. Despite a price recovery in May, volume dipped to the year's low, while May volumes rebounded as BTC dipped below $60,000.
Relative market share among the top 10 Perp CEXes remained largely stable. MEXC posted a brief surge in April and early May, but those gains dissipated by June.
Editor's note: The data points to a market contracting from the inside out, not merely repricing. A third consecutive quarterly decline is significant on its own; a stablecoin drawdown occurring alongside it — the first since Q3 2023 — is potentially more telling, as it may signal capital exiting the industry rather than rotating within it. Falling spot volumes and a widening gap between struggling majors and outperformers like Hyperliquid's HYPE reinforce that interpretation.
The information provided in this article is for educational purposes only and does not constitute financial, investment, or trading advice.

