Zcash Price Holds Firm as Bitcoin Slips: Base or Bear Flag?
Key Takeaways
- •ZEC traded at $1,240 at 15:37 UTC on Friday, gaining roughly 1.4% while Bitcoin tested its $76,000 support shelf and XRP corrected within a falling channel.
- •The daily chart shows a six-day rising channel, with every pullback halting at higher lows above the 0.382 Fibonacci floor near $1,142.
- •Sellers have repeatedly rejected tests of the $1,310–$1,354 resistance band, which spans the 50-day simple moving average and the 0.236 Fibonacci level.
- •The Zcash network marked its tenth anniversary on October 28, and the NU7 upgrade, scheduled for around November 5, will cut target block times from 75 seconds to 25.
- •A daily close below $1,142 could open a decline toward the $971–$994 zone, while a close above $1,354 would invalidate the bear-flag reading and open a path toward $1,500.
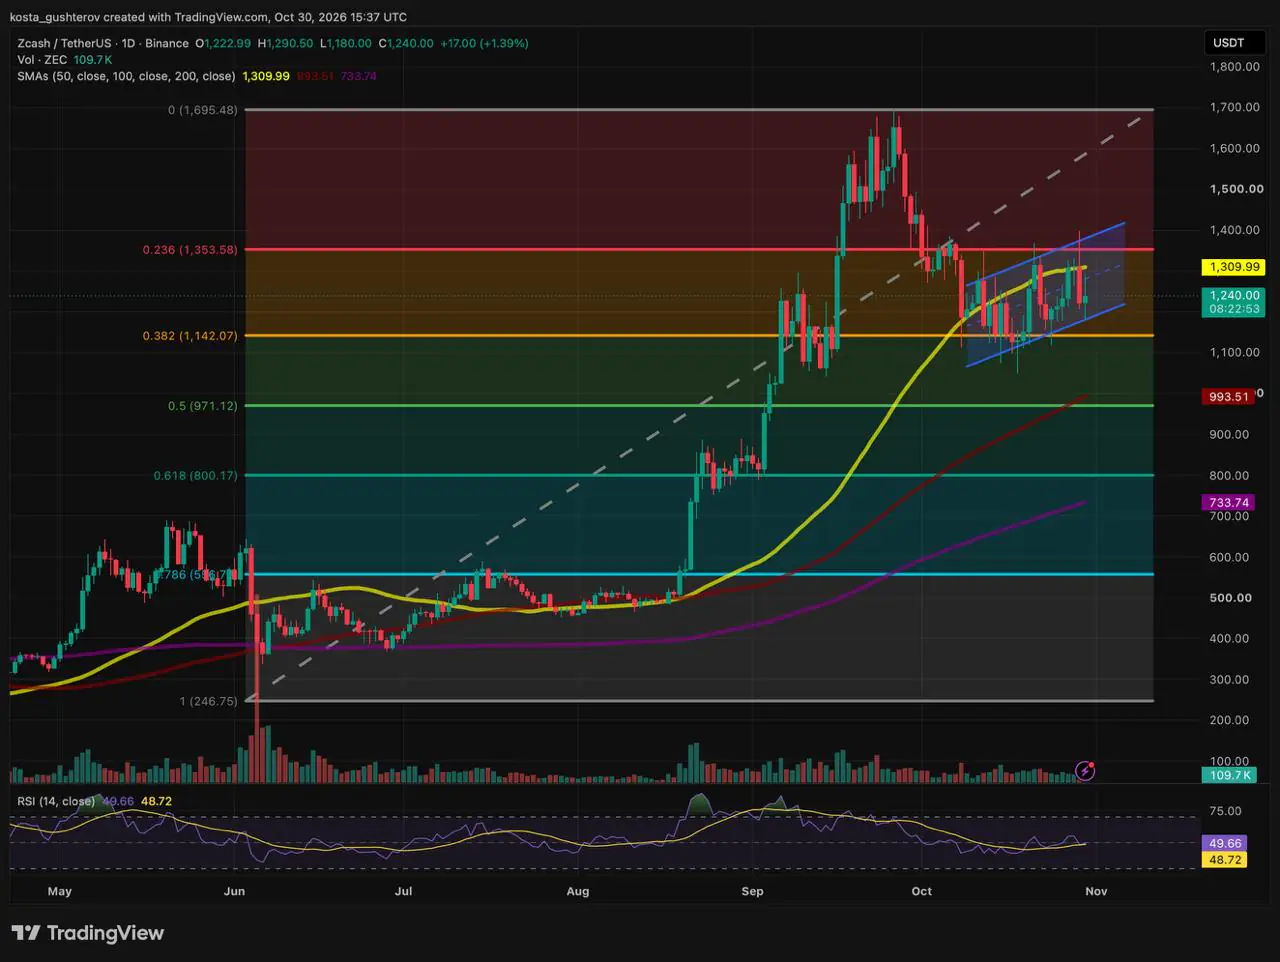
ZEC traded at $1,240 at 15:37 UTC on Friday, up roughly 1.4% on the day, according to the Binance ZEC/USDT daily chart. The token's steadiness stands out against a softer broader market, yet the technical picture remains split between two opposing interpretations.
ZEC Builds Higher Lows While the Wider Market Slips
Friday's daily candle opened at $1,223, dipped to $1,180, pushed to an intraday high of $1,291 and last changed hands at $1,240 on volume of 109.7K ZEC. The dip landed directly on the lower rail of a rising channel that ZEC has been constructing over the past six days, roughly $38 above the horizontal floor formed by the 0.382 Fibonacci retracement near $1,142.
A week ago, ZEC was simply testing that floor from above. Since then, every pullback has halted a little higher than the last, tracing the rising channel visible on the daily chart.
That is a markedly different picture from the rest of the market. Bitcoin slid this week to test its $76K support shelf, and XRP has been correcting inside a falling channel since late September. ZEC buyers, by contrast, have stepped in at progressively higher levels on every dip of the past several days.
Two calendar milestones fall inside this stretch of outperformance. The network marked its tenth anniversary on October 28, and its NU7 upgrade, which cuts target block times from 75 seconds to 25, is scheduled for around November 5.
Why the Bullish Structure Is Not the Whole Story
The channel keeps running into the same ceiling. Two sessions ago, a strong green candle pushed above the 50-day simple moving average (SMA) to probe the area near the 0.236 Fibonacci level at roughly $1,354, but sellers answered in the previous session with an engulfing red candle that drove price straight back below $1,310. Friday's rebound stalled at $1,291, about $19 short of the moving average. Each test of the $1,310–$1,354 band has so far been met by sellers treating the push higher as a chance to exit.
The timing of the channel adds to the doubt. It formed immediately after a steep October decline from the $1,695 cycle peak to around $1,080. A choppy, overlapping channel that slopes upward against a sharp fall, and repeatedly fails at the 50-day SMA, carries the signature of a bearish continuation flag.
Two Readings of the Same Candles
Reading 1: a base being built
- Higher lows, with each dip bought at successively higher prices
- Relative strength rising while BTC and XRP fall
- The floor holding, with buyers active above the 0.382 Fibonacci level
Reading 2: a bear flag
- Forming after a sharp drop from $1,695 to around $1,080
- Overlapping candles that are choppy rather than impulsive
- Capped price action, with no sustained close above the 50-day SMA
Both readings fit the same candles. Which one prevails depends on the channel's edges: a break above the ceiling or a break of the lower rail.
Momentum Signals a Standoff
Neither side is in control yet. The 14-day RSI sits at 49.7, almost exactly on the neutral 50 line and only a touch above its signal line at 48.7. That reading reflects a standoff between dip buyers defending the lower rail and sellers defending the ceiling, and it says little about direction until price leaves the channel.
The Channel's Two Exits
Which exit ZEC takes remains an open question, and the channel offers two ways out.
Exit through the floor. If ZEC closes a daily candle below the lower rail around $1,180 and then loses the horizontal floor near $1,142, the two-week channel would resolve as a bear flag capped by the 50-day SMA. A break under $1,142 could then open a faster decline toward the $971–$994 zone, where the 0.500 Fibonacci retracement converges with the rising 100-day SMA.
Exit through the ceiling. If buyers build on Friday's bounce, backed by 109.7K ZEC of volume, and force a decisive daily close above both the 50-day SMA near $1,310 and the ceiling near $1,354, the bear-flag reading would no longer hold. The $1,310–$1,354 band could then begin acting as support. Clearing the upper rail and the broken dashed trendline could open a move back toward $1,500 and a retest of the $1,695 peak.
Safety Nets Below
Below the channel, support comes in layers. The first has strengthened recently: the 100-day SMA has climbed to around $994, just under the $1,000 mark, and now sits close to the 0.500 Fibonacci level near $971. Beneath that lie the golden pocket near $800 and the 200-day SMA at $734, the line that marks the long-term uptrend. The deep 0.786 Fibonacci level near $557 and the June origin near $247 mark where the entire run began, and price remains a long way above both.
This article is provided for informational purposes only and does not constitute financial or investment advice. Technical levels and scenarios do not guarantee future price movement.

