Zcash (ZEC) Pulls Back Toward 50-Day EMA as Momentum Indicators Soften
Key Takeaways
- •Zcash has repeatedly failed to break above a descending resistance trendline near $581, indicating sellers remain active during rallies.
- •Despite near-term weakness, ZEC continues to trade above its 50-day EMA at $489 and 200-day EMA at $407, keeping the longer-term bullish trend intact.
- •The RSI sits near 52 while the MACD has slipped below zero, reflecting a consolidation phase with neither buyers nor sellers in clear control.
- •A decisive move above the $581 trendline could target the $690 swing high, whereas a break below the 50-day EMA risks a deeper correction toward the $407 support zone.
- •Privacy coins including Zcash operate under heightened regulatory scrutiny across multiple jurisdictions, adding a non-technical risk factor for market participants.
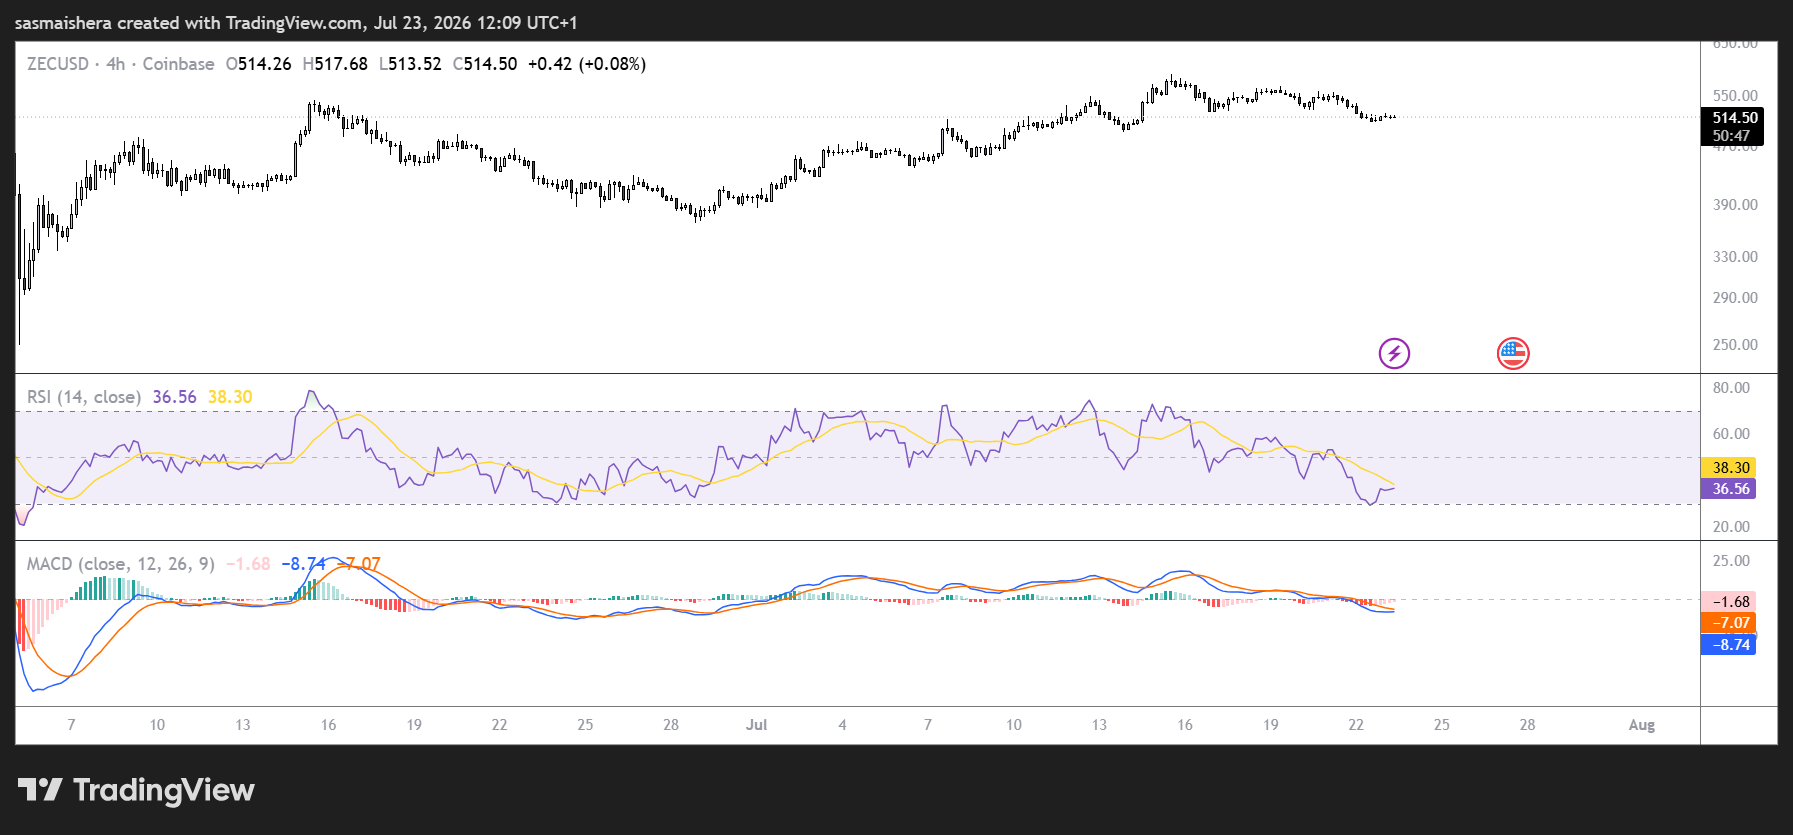
Zcash (ZEC) extended its recent pullback on Thursday, holding above the $500 level but facing continued selling pressure along a descending resistance trendline. While short-term momentum has weakened, the privacy-focused cryptocurrency remains perched above key long-term moving averages, leaving its broader bullish structure intact for now. Zcash, which uses zero-knowledge proofs (zk-SNARKs) to enable shielded transactions, competes in the privacy-coin sector alongside assets like Monero (XMR) and Dash — a niche that has drawn heightened regulatory scrutiny in several jurisdictions.
Descending Trendline Caps Upside
ZEC has repeatedly struggled to break above a descending trendline currently positioned near $581. Multiple rejections at this resistance indicate that sellers remain active during rallies, effectively preventing the token from building on its prior bullish advance.
Despite the near-term weakness, Zcash continues to trade above both its 50-day Exponential Moving Average (EMA) at $489 and its 200-day EMA at $407. Maintaining these levels suggests that buyers still control the longer-term trend, even as short-term momentum cools.
Momentum Indicators Flash Mixed Signals
Technical indicators present a balanced outlook for ZEC. The Relative Strength Index (RSI) is hovering around 52, close to the neutral 50 threshold, indicating that neither buyers nor sellers have established clear dominance and that the market is in a period of consolidation.
Meanwhile, the Moving Average Convergence Divergence (MACD) has slipped below the zero line, signaling that bullish momentum has weakened in the near term. While the MACD points to growing downside pressure, the broader market structure remains constructive as long as critical support levels hold.
Key Resistance and Support Levels
The first major hurdle for ZEC is the descending resistance trendline near $581. A successful breakout above this barrier would strengthen the bullish case and could open the path toward a retest of the previous swing high around $690, signaling renewed buying interest and a potential restart of the broader uptrend.
On the downside, the 50-day EMA at $489 serves as the most immediate and critical support. A sustained move below this level could expose ZEC to additional selling pressure. However, the 200-day EMA at $407 remains a robust longer-term support zone that could attract buyers should the correction deepen.
Outlook
Zcash remains in a healthy long-term uptrend despite its recent pullback. Although weakening momentum and resistance near $581 continue to cap gains, the token's ability to hold above both its 50-day and 200-day EMAs suggests the broader bullish structure has not been invalidated.
A decisive break above the descending trendline would likely shift momentum back in favor of buyers, while a loss of support at the 50-day EMA could trigger a deeper correction before the next upward move. Beyond the charts, ongoing developments in Zcash's protocol roadmap and the evolving regulatory landscape for privacy coins remain factors that participants are monitoring.

