Zcash (ZEC) Crashes Through $800 With Little Support Below
Key Takeaways
- •ZEC broke below the $800–$810 zone containing the 200-day moving average at $810 and the 0.618 Fibonacci retracement near $800, falling as low as $746 and trading near $763, down 14.67% on the day.
- •ZEC has now lost all three daily moving averages sequentially: the 50-day in October, the 100-day in mid-November, and the 200-day on Friday.
- •The next labeled support sits at the 0.786 Fibonacci retracement near $560, roughly 27% below Friday's trading price, because the chart shows almost no closing prices between roughly $550 and $800.
- •The 14-day RSI read 29.52, a fresh crossing into oversold territory below 30, while volume of 238.25K ZEC remained small compared with the spikes that marked the June low and the late-August breakout.
- •The falling 50-day average at $1,169 has narrowed its gap with the rising 100-day at $1,116, creating the chart's densest resistance band and setting up a potential death cross if the gap continues to close.
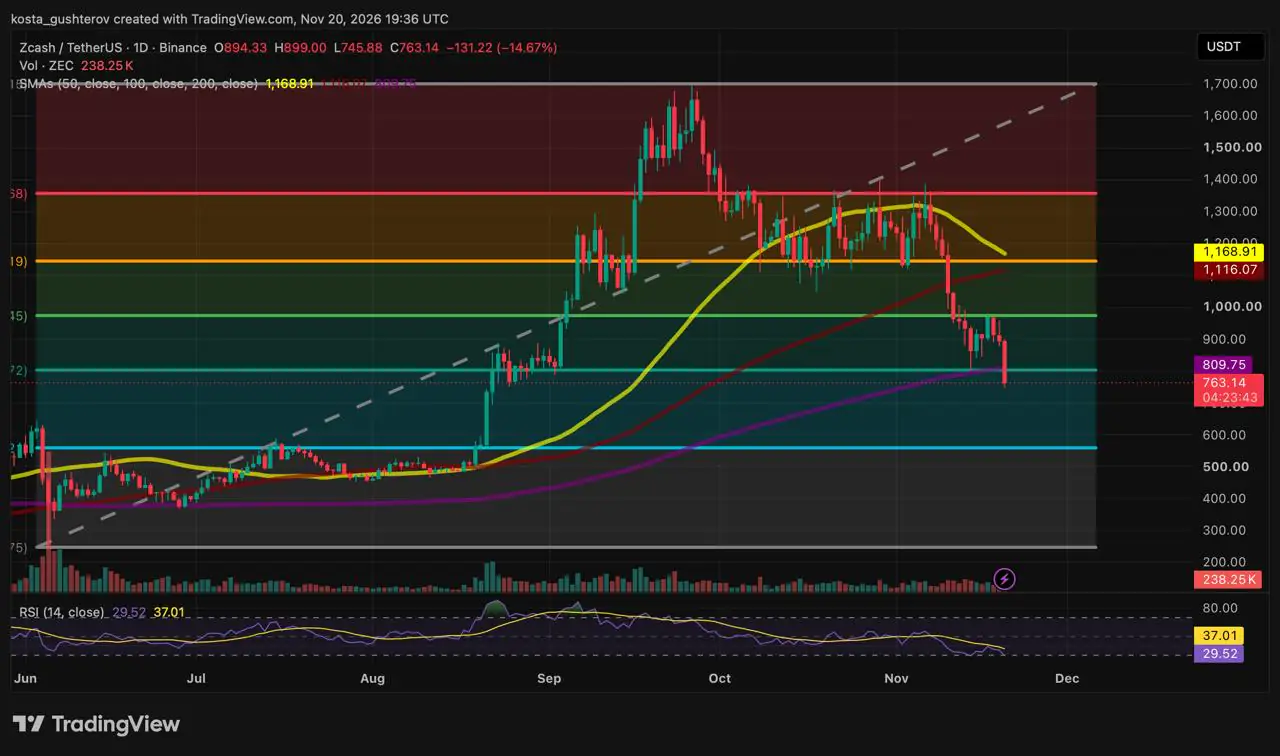
Zcash (ZEC) fell sharply on Friday, slicing through the $800–$810 support zone as part of a broader selloff across the crypto market. The token opened the session near $894, touched $899, and dropped as low as $746. As of 19:36 UTC, with more than four hours remaining, ZEC traded near $763, down 14.67% on the day.
Break Through a Tested Zone
The breakdown pushed the price below two levels that sit almost on top of each other: the 200-day simple moving average at $810 and the 0.618 Fibonacci retracement near $800. The 200-day average is a running mean of the past 200 daily closes and ranks among the most closely watched long-term trend lines in technical analysis, while Fibonacci retracements mark fixed percentages of a prior price swing that traders monitor for potential support or resistance. The zone had already been tested once, as ZEC's first leg down in mid-November stopped just above it before buyers pushed the price back up.
When ZEC traded near $921 earlier this week, Coindoo's weekly chart analysis identified the 200-day average as the nearest daily support if the weekly channel floor gave way. On Friday, the candle went straight through it, taking ZEC back to prices last seen in late August.
A Decline That Accelerated
Each support has held for less time than the one before it. The October range kept ZEC elevated for about five weeks, while the mid-November low lasted roughly one. The bounce that followed stalled at the 0.5 retracement level near $975.
Little Trading History Below $746
Friday's low near $746 marks the bottom of the area where ZEC paused after its August breakout. Below it, the climb from roughly $550 to $800 happened so quickly that the chart shows almost no closing prices in between. That is why the next labeled support sits as far down as the 0.786 retracement near $560.
Averages Lost, Momentum Just Turning Oversold
ZEC has now lost all three daily moving averages, one at a time: the 50-day in October, the 100-day in the mid-November break, and the 200-day at $810 on Friday.
Higher up, the 50-day average at $1,169 is falling fast toward the 100-day at $1,116, which is still rising but flattening. The 0.382 retracement near $1,145 sits between the two, making $1,116–$1,169 the densest resistance band on the chart. The 50-day remains above the 100-day, but the gap between them has narrowed sharply since early November. Should the gap continue to close, a cross of the 50-day below the 100-day is the pattern known in technical analysis as a death cross.
The 14-day relative strength index (RSI) reads 29.52, just under the 30 line that marks oversold territory and well below its own average at 37.01. It has only just crossed that threshold — a fresh oversold reading, not a deep one.
Volume reads 238.25K ZEC with more than four hours left in the session, small next to the spikes that marked the June low and the late-August breakout. Nothing on the chart yet resembles the volume of a washout. Volume is one of the measures technicians read for signs of broad participation behind a move, so the absence of a spike so far leaves that part of the breakdown unresolved.
What the Daily Close Sets Up
The session leaves ZEC with resistance about 6% above, at the 200-day average, and the next labeled support about 27% below, near $560. With more than four hours left in the session at the time of writing, the daily close and the final volume tally were not yet set, so the candle's exact placement between those two levels remains to be printed on the chart.
This article is for informational purposes only and is not financial, investment or trading advice. The levels and scenarios describe chart conditions, not price predictions. Cryptocurrencies are highly volatile; do your own research before making any decision.
This article originally appeared on Coindoo.

