Zcash Price Tests Key Channel Floor on the Weekly Chart
Key Takeaways
- •Zcash trades around $921, approximately 45% below its September peak near $1,700, after probing the floor of a rising weekly channel.
- •The pullback followed the NU7 upgrade activation on November 6, outflows from Grayscale's Zcash Trust in early November, and an open development-funding vote with a November 30 deadline.
- •The weekly channel floor aligns with the 0.618 Fibonacci retracement near $877, and no weekly close has yet broken the higher-low sequence in place since March.
- •The first overhead resistance band spans the $1,050 area, pairing the 0.5 retracement near $1,034 with the 100-day SMA around $1,104, while a second band sits near $1,191 to $1,199.
- •A weekly close below the channel and the 0.618 retracement would be the first warning of a breakdown, leaving the 200-day SMA near $802 as nearest support and the 0.786 retracement near $654 as the next chart level.
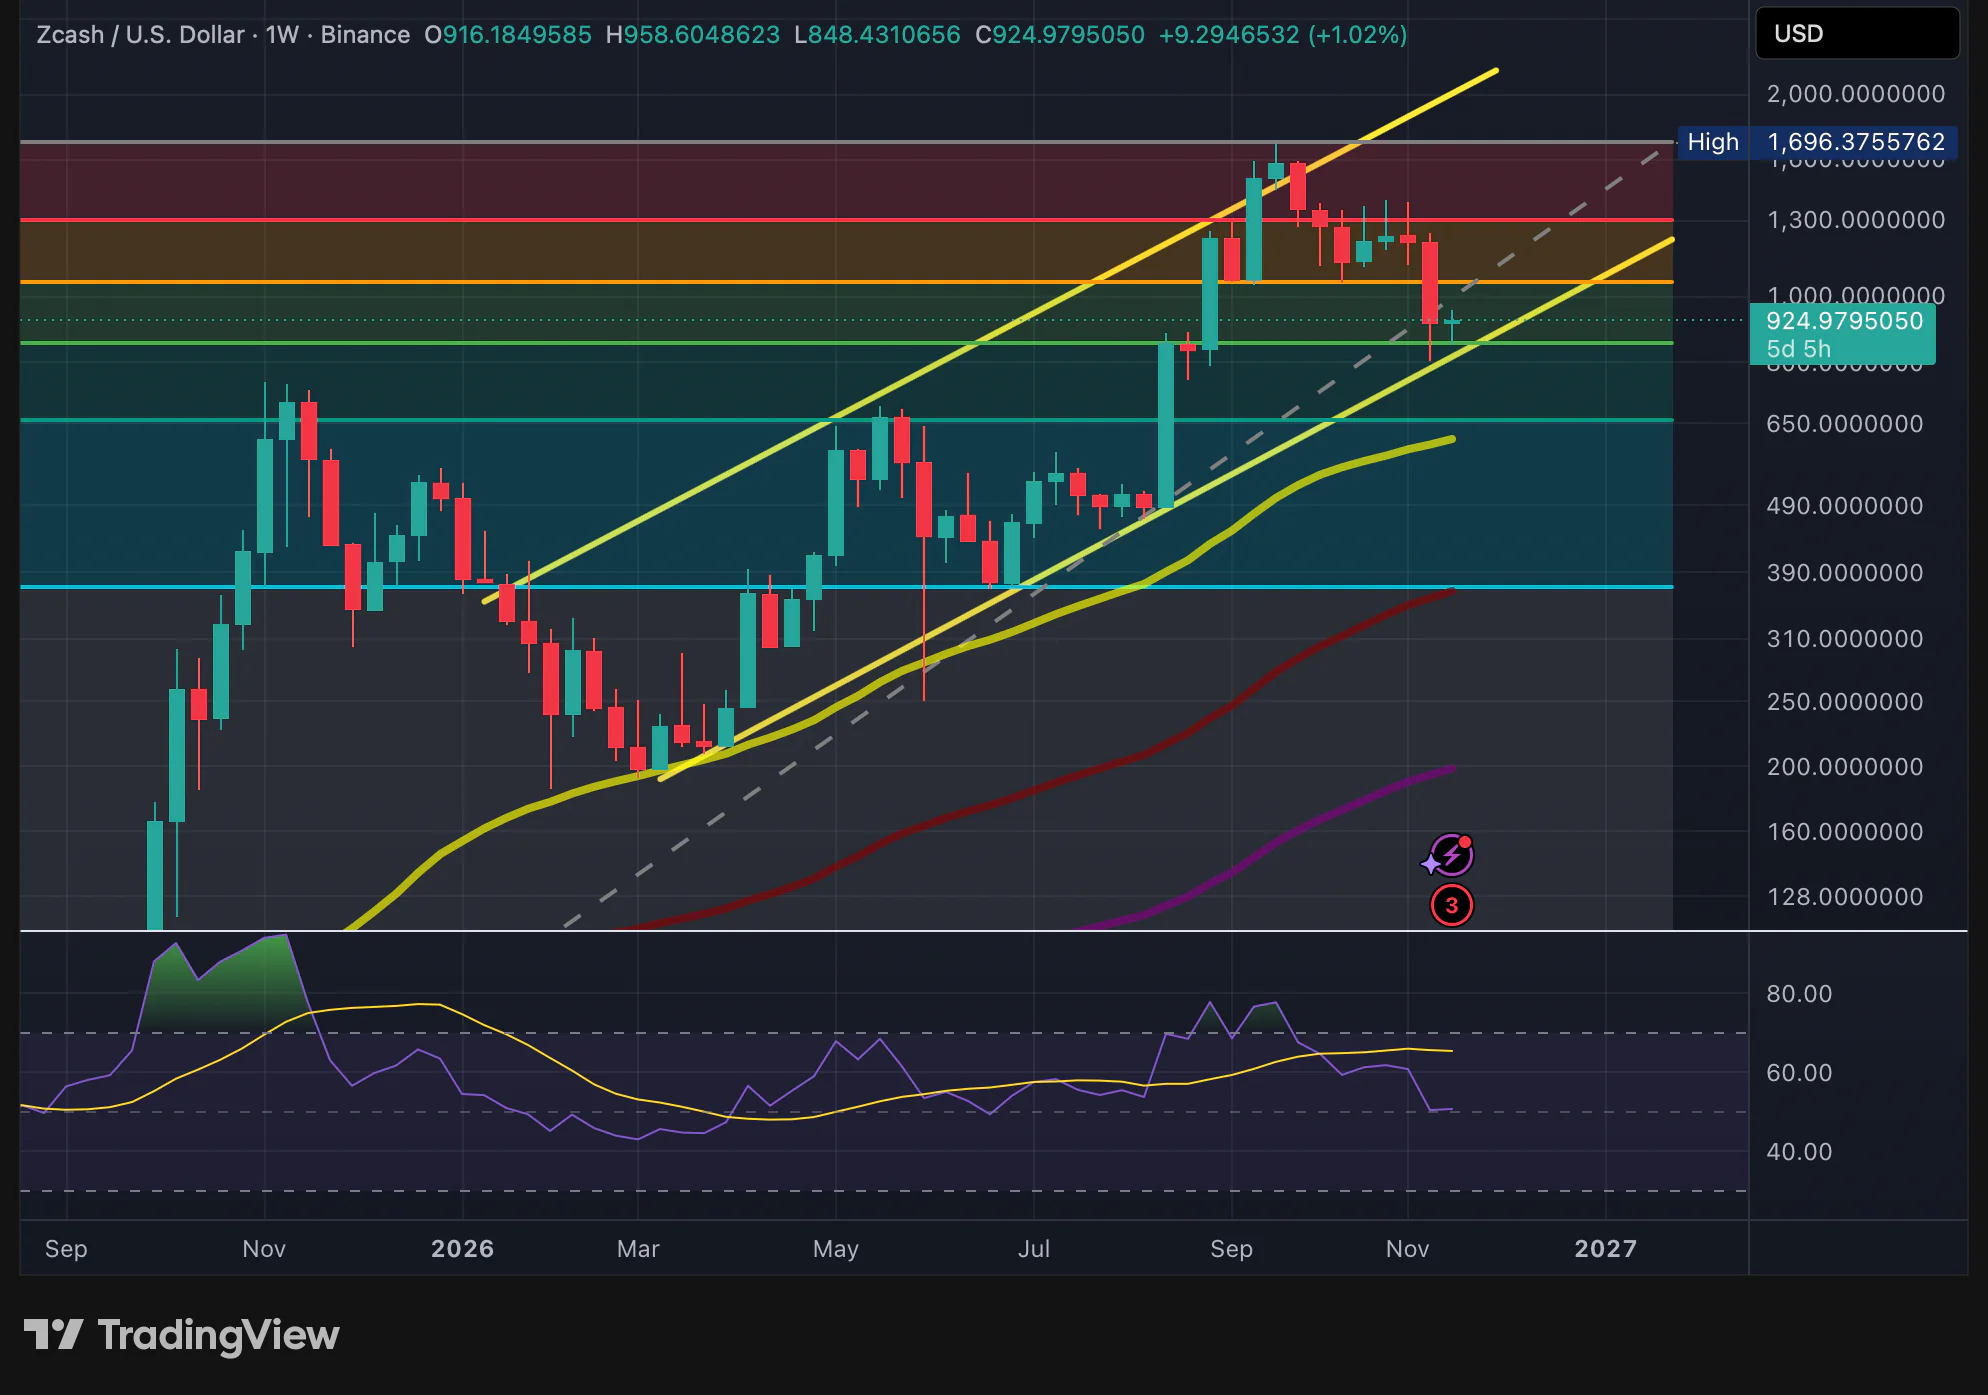
Zcash (ZEC), a privacy-focused cryptocurrency, is trading around $921, roughly 45% below its September high and pressed against the lower boundary of a rising weekly channel after a two-month pullback that has unwound a large share of the token's gains from earlier this year. The decline followed the activation of the NU7 network upgrade on November 6, Grayscale's Zcash Trust — a fund that holds ZEC on behalf of shareholders — recording outflows in early November, and a community vote on development funding that remains open until November 30.
The Weekly Chart: Higher Lows Meet the Channel Floor
Since March, ZEC has built a series of higher lows within a rising channel on the weekly chart. That structure carried the price to a September high near $1,700 and is the reason the broader structure remains bullish. The past two months have taken back a large portion of that advance, and this week's candle dipped below the channel floor before recovering — the floor has been probed, but it has not broken on a weekly close basis.
The channel's lower boundary currently runs close to the 0.618 Fibonacci retracement near $877, measured from the June low near $369 to the September high. Fibonacci retracements are a standard charting tool for measuring how much of a prior move prices have given back, and the 0.618 ratio is among the most closely watched levels in that framework. For now, holding the channel and defending that retracement amount to the same test.
The weekly RSI, a momentum indicator that runs from 0 to 100 with readings above 70 generally treated as overbought and below 30 as oversold, has fallen from overbought territory in September to the 50 midline — a neutral reading that is neither stretched nor oversold. The 50-week SMA, which averages the past 50 weekly closes and is often used as a long-term trend gauge, continues to rise and remains well below the current price.
The Daily Chart: Where the Bounce Started
The recent low formed at the intersection of the 200-day SMA, now around $802, and the descending trendline drawn from the September peak. Price has bounced from that confluence.
During the sell-off, the daily RSI dropped close to the 30 oversold line and has begun to turn up, although it still sits below its signal line. ZEC is trading just above the 0.618 retracement, and a daily close above that level would confirm that buyers are defending it.
The $1,050 Area and the Resistance Above
The area around $1,050 lies within the first band of overhead resistance, defined by the 0.5 retracement and the 100-day SMA. The dashed midline of the weekly channel crosses the same zone. ZEC fell through this band during the November sell-off and has not traded back above it since.
- First band: 0.5 retracement near $1,034; 100-day SMA around $1,104
- Second band: 0.382 retracement near $1,191; 50-day SMA around $1,199
Each band pairs a Fibonacci level with a moving average, so even a daily close above the first band would leave the second one overhead. The 50-day SMA has also turned lower after flattening through October.
What the Weekly Close Will Decide
Because the channel is drawn on the weekly chart, the weekly close is the one that counts. Price can trade outside the boundary midweek, as it did this week, but only a completed weekly candle settles whether the floor has held or given way.
If the floor holds: A weekly close inside the channel keeps the rising structure intact. The first resistance inside the channel is the $1,050 area, and a daily close above the first band is the condition for the stronger bullish momentum of earlier in the year to return.
If the floor gives way: A weekly close below the channel and the 0.618 retracement would be the first warning. A retest of the broken boundary from below that fails to reclaim it would confirm the breakdown. The 200-day SMA, which produced this week's bounce, would then be the nearest support. Below it, the 0.786 retracement near $654 is the next level on the chart, with the 50-week SMA rising toward the same area.
What Hasn't Changed
No weekly close has broken the higher-low sequence that began in March. Until a weekly close and a subsequent retest settle the channel question, the weekly trend remains one of higher lows. Even after the pullback, ZEC at around $921 still trades at roughly two and a half times its June low near $369 — a measure of how much of the year's net advance has withstood the correction. The next dated checkpoints are the weekly closes themselves and the November 30 deadline for the development-funding vote.
This analysis is for informational purposes only and does not constitute financial or investment advice.
This article originally appeared on Coindoo: Zcash Price at a Key Floor on the Weekly Chart.

