Zcash Price Snaps Back 6% as the 50-Day SMA Comes Into View
Key Takeaways
- •Zcash rallied more than sixfold from around $254 in early June to its 2026 high near $1,690 in late September, and even after Tuesday's bounce it remains about 28% below that peak.
- •Buyers defended the 0.382 Fibonacci retracement near $1,140 for roughly a week, with intraday dips toward $1,050 failing to produce a deeper decline.
- •Tuesday's session pushed price above the falling channel's upper boundary, but the breakout still requires a daily close to be confirmed.
- •The two key resistance zones overhead are the 50-day simple moving average near $1,270 and the 0.236 Fibonacci retracement near $1,350, sitting roughly 4% and 10% above current levels.
- •The relative strength index has turned up to about 49 and crossed above its signal line, nearing the 50 midpoint that could indicate buyers regaining short-term momentum.
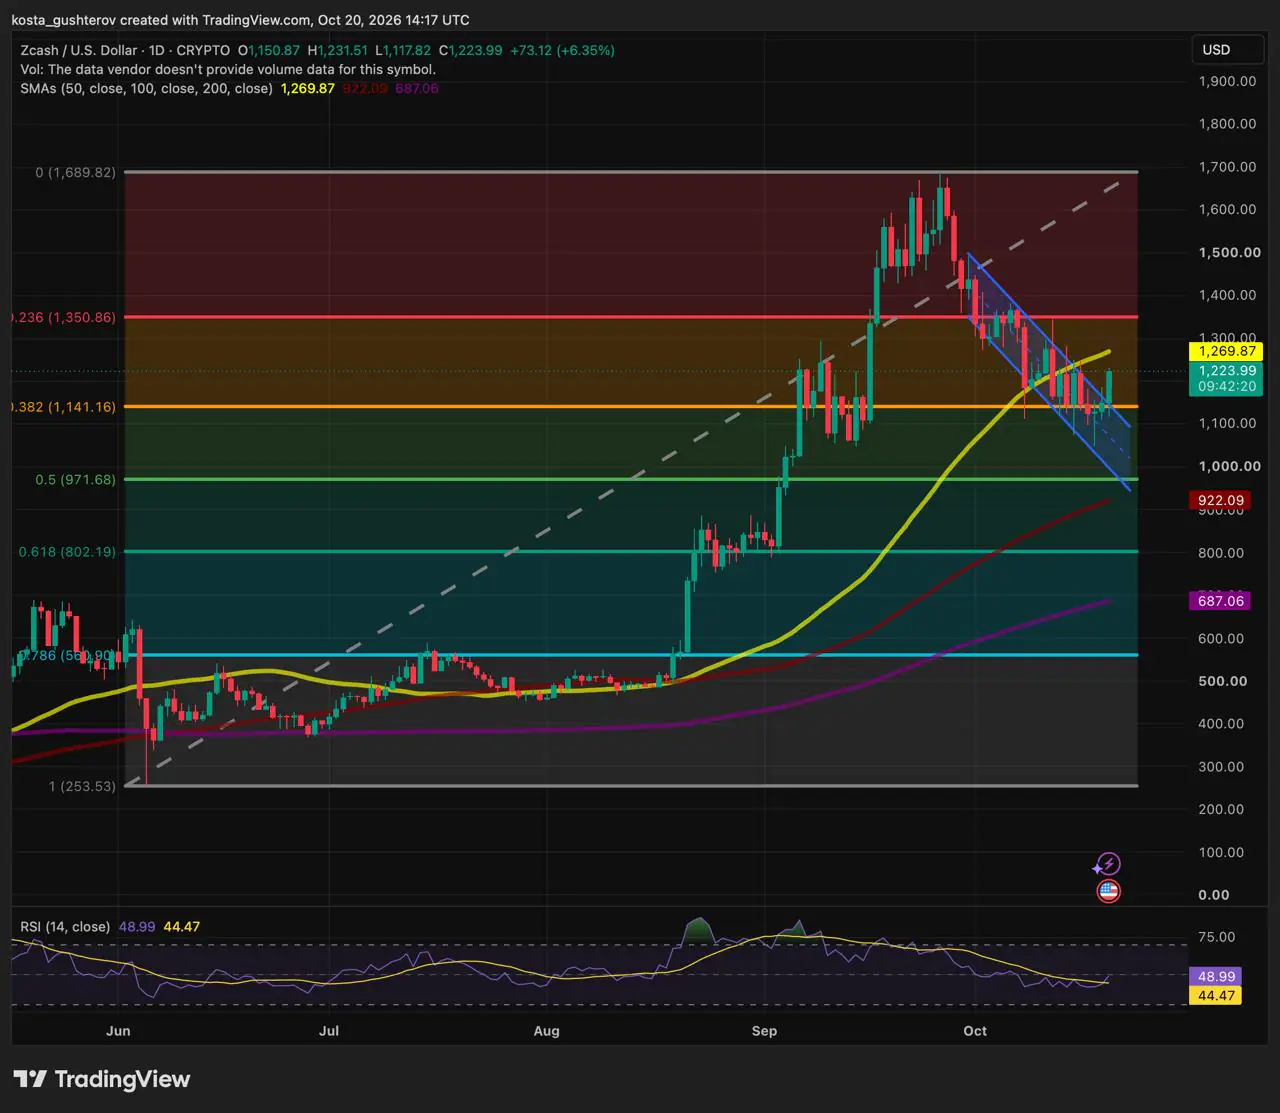
Zcash (ZEC) staged a sharp intraday rebound on Tuesday, with the session's range spanning roughly $1,118 to $1,232 after opening at $1,151. The recovery brings two key resistance zones into view: the 50-day simple moving average (SMA) near $1,270 and the 0.236 Fibonacci retracement near $1,350 — approximately 4% and 10% above current levels. Even after the bounce, ZEC remains about 28% below its late-September peak near $1,690.
After a run that carried the token more than sixfold higher in under four months, the significance of this particular test is straightforward: it speaks to whether October's correction remains a routine pullback inside a larger uptrend or develops into something deeper. The resistance band between roughly $1,270 and $1,350, and the $1,140 floor below, frame that question on the chart.
Buyers Step In at $1,140
Between early June and late September, ZEC rallied more than sixfold, climbing from around $254 to its 2026 high near $1,690. The subsequent correction carved out a short falling channel and dragged the price back to the 0.382 Fibonacci retracement of that advance, near $1,140. Fibonacci retracements — horizontal levels projected from standard ratios of a prior advance — are among the most widely watched reference points for where a correction may find support, which is why the defense of this zone has drawn attention.
The token spent roughly a week chopping around that support, with candle wicks dipping toward $1,050, yet sellers failed to convert those intraday dips into a deeper slide. Tuesday's session flipped the tone: after briefly trading below its opening level, ZEC ripped higher and broke through the channel's upper boundary — though the daily candle has yet to close.
Two Hurdles Overhead
The first obstacle is the 50-day SMA near $1,270. By smoothing roughly the past two months of closing prices into a single line, this average serves many traders as a quick gauge of the intermediate-term trend. ZEC slipped beneath this average in mid-October, so reclaiming it could mark the end of the short-term downtrend rather than just another bounce within it.
The second is the 0.236 Fibonacci level near $1,350. That zone marked the starting point of October's breakdown and capped a mid-month rebound, when a wick reached about $1,345 before sellers took over again — an illustration of how a level that once supported a trend can flip into resistance once it breaks.
Momentum Improves, but the Breakout Still Needs a Close
The relative strength index (RSI), a momentum gauge measured on a 0–100 scale, has turned up to about 49, crossing above its signal line and nearing the 50 midpoint. A push above 50 could signal that buyers are regaining short-term control after three weeks of fading readings.
Bears, however, retain a fair argument: the daily candle is still open, price sits below the 50-day SMA, and the last time ZEC rallied into resistance this month, the move faded within days.
Potential Moves
ZEC currently sits between the 50-day SMA overhead and the support it has just defended below.
Upside: A daily close above the 50-day SMA this week could confirm the channel breakout and open room toward the $1,350 area. A move through that level could put the September highs back in view.
Rejection: A rejection at the 50-day SMA could send ZEC back to retest $1,140. A daily close below that level before the end of October could expose the 0.5 Fibonacci retracement near $970.
Bigger picture: ZEC still trades more than 380% above its June low, and all three daily SMAs are rising. A drop through $970 could bring the 100-day SMA and the 0.618 Fibonacci level into view.
This article is provided for informational purposes only and does not constitute financial advice. Cryptocurrency prices are volatile. Originally published on Coindoo.

