Zcash targets $1,134 as ZEC futures demand rises
Key Takeaways
- •Zcash rebounded roughly 3% to trade near $944 on Wednesday after falling about 24% the previous week.
- •Futures open interest rose 1% to approximately $2 billion on Wednesday, up from $1.9 billion on Sunday, signaling fresh leveraged participation in the derivatives market.
- •Zcash ETFs saw about $30 million in net outflows last week, followed by an additional $9.03 million on Monday, highlighting persistent weak institutional demand.
- •The taker buy-to-sell ratio climbed above 1, showing aggressive buying exceeded selling, while the RSI near 38 suggests bearish momentum is moderating even as the MACD remains negative.
- •ZEC must reclaim the $1,050-$1,134 resistance area to confirm a recovery, with the $888-$876 support zone and a downside reference near $744 as the key levels to watch.
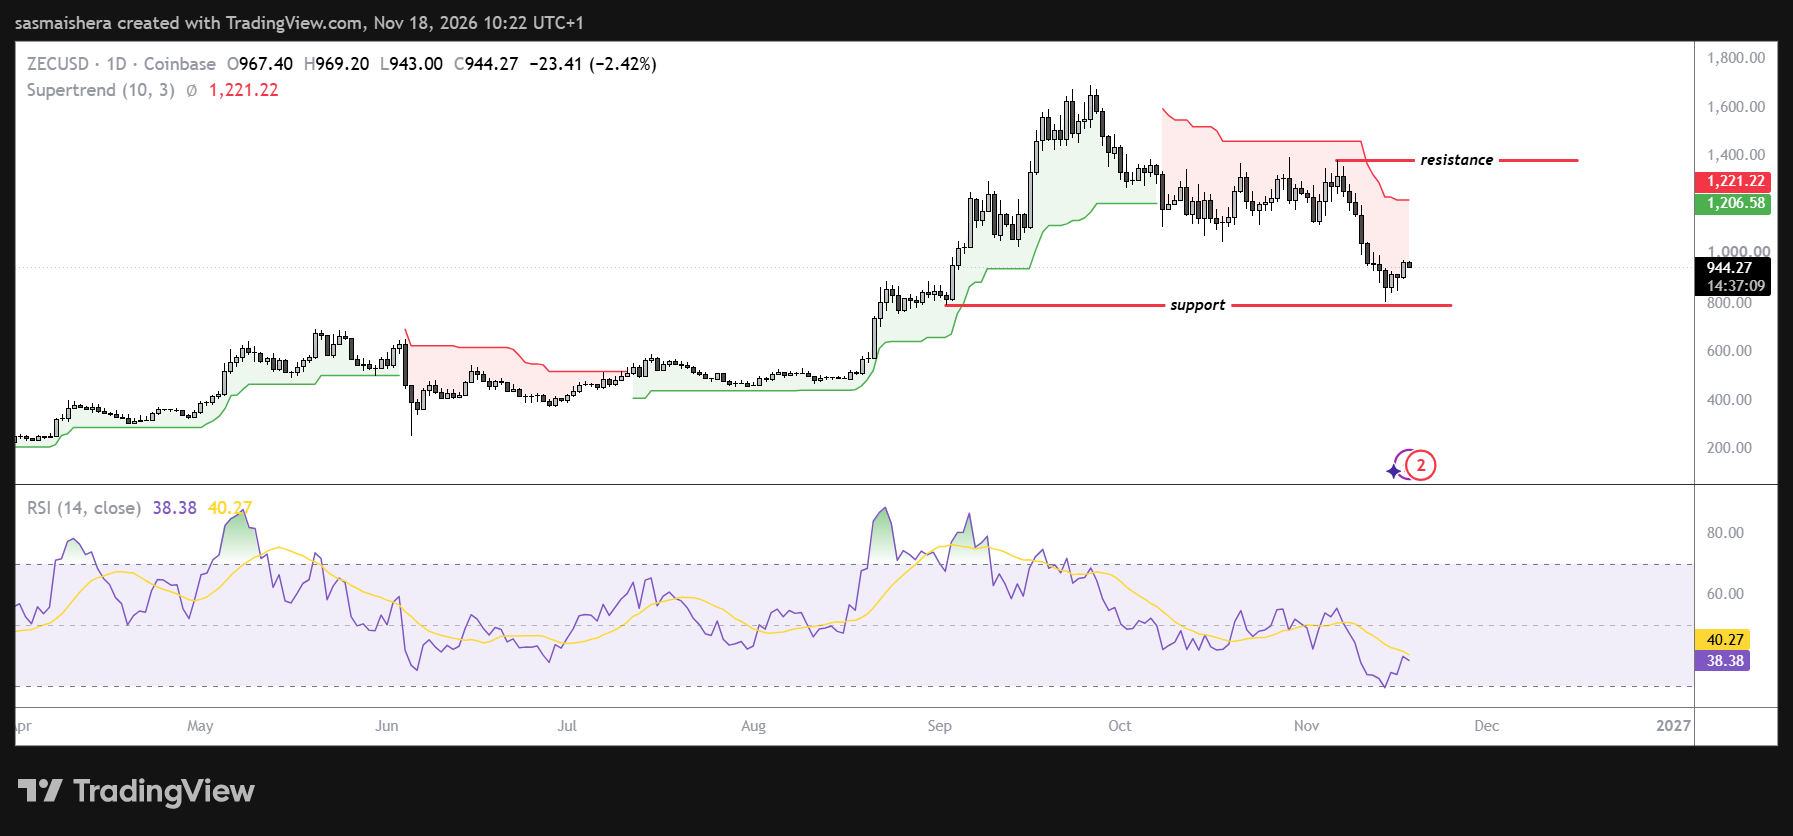
Zcash (ZEC) traded around $944 on Wednesday after gaining approximately 3% in the previous session, as renewed derivatives activity supported a possible recovery. The privacy-focused cryptocurrency has stabilized above $940 after declining approximately 24% last week.
ZEC futures Open Interest (OI) increased by 1% to approximately $2 billion on Wednesday, up from $1.9 billion on Sunday, according to CoinGlass. Open Interest measures the total value of futures contracts that have been opened but not yet closed, so rising OI is commonly read as a gauge of fresh leveraged participation. The increase points to greater participation in the derivatives market as traders open new positions.
However, institutional demand through exchange-traded investment products remains weak. According to SoSoValue, Zcash ETFs recorded approximately $30 million in net outflows last week. The withdrawals continued into the new week, with another $9.03 million in outflows recorded on Monday. On Tuesday, the products reported no net inflows or outflows. The split between rising futures positioning and continued ETF outflows underscores that the recent stabilization has so far drawn on derivatives traders rather than institutional allocations, and upcoming daily flow reports will show whether that gap narrows.
Futures activity increases as traders return
Zcash’s taker buy-to-sell ratio also climbed above 1 on Wednesday, compared with approximately 0.973 last week. A reading above 1 means that aggressive buying exceeded aggressive selling, indicating that buyers were executing more trades at prevailing market prices. This could help absorb some sell-side pressure, although persistent withdrawals from exchange-traded products may continue to weigh on the market during periods of heightened volatility.
The increase in derivatives activity followed a sharp correction in ZEC. The token fell approximately 24% last week and moved below its 50-day Exponential Moving Average near $1,134. That breakdown weakened the short-term technical structure and increased selling pressure.
Buyers returned as ZEC approached its 200-day EMA around $876. Because the 200-day EMA is widely watched as a long-term trend gauge, the area around it is treated by technical analysts as an important line of defense. The rebound lifted the token by approximately 3% on Tuesday and helped it stabilize above $944. At that level, ZEC would need to rise approximately 16% to reclaim the $1,134 moving average. The recovery indicates that selling pressure has eased, but it does not confirm that the broader correction has ended.
ZEC remains below key resistance levels
Momentum indicators show that recent selling pressure may be moderating. The daily Relative Strength Index (RSI) stood near 38 after recovering from the oversold boundary. Although the RSI remained below the neutral 50 level, its recovery suggested that bearish momentum had become less intense.
The Moving Average Convergence Divergence indicator remained in negative territory, however, indicating that the broader momentum structure continued to favor sellers.
Zcash faces several resistance levels if buyers attempt to extend the rebound. The psychological $1,000 level is the first short-term milestone, while the first major horizontal resistance is near $1,050. A sustained move above $1,000 could support additional buying, but a decisive breakout above $1,050 would provide stronger evidence that the recovery was gaining strength.
The 50-day EMA around $1,134 represents the next significant technical obstacle. Reclaiming that moving average would offer stronger evidence that Zcash’s bearish momentum is weakening. A sustained daily close above the $1,050–$1,134 resistance region could open the way toward the next major upside reference near $1,698.
On the downside, initial support is near $888, with the 200-day EMA around $876 just below it. Together, these levels form a concentrated support zone. A successful defense of the $888–$876 region could allow the recovery attempt to continue. Conversely, a sustained break below the support cluster would weaken the technical outlook and expose Zcash to further losses toward $744.
The $744 level is the next important downside reference if sellers regain control. For now, ZEC’s near-term technical picture has improved, but a sustained bullish reversal remains unconfirmed while the token trades below $1,134. In the sessions ahead, the daily ETF flow figures and ZEC’s behavior around the $888–$876 support zone will be the key data points to watch as the market weighs whether the rebound can extend.
Source: CoinJournal

