XRP's Two-Week RSI Hits a 13-Year Low as Price Tests Long-Term Support
Key Takeaways
- •XRP's two-week RSI sits near 33.5, the lowest reading shown across roughly 13 years of trading data, placing momentum in oversold territory.
- •The token fell from $1.49 on September 14 to about $1.27 on September 15 before recovering to trade near $1.29–$1.30.
- •The current momentum reading is more stretched than levels recorded during the 2018 lows, the 2020 COVID crash, and the 2022 bear market.
- •Dark Defender's Elliott Wave analysis within a rising channel marks Fibonacci reference levels at $1.8815, $2.9032, $18.2275, $36.7676, $74.3956, and a long-range extension at $333.1167, all dependent on the wave sequence unfolding as mapped.
- •JackTheRippler identifies a bull-flag consolidation between roughly $1.35 and $1.50 after a rise from near $1.05, mapping a potential move toward $1.70–$1.80 only if XRP breaks above the descending pattern.
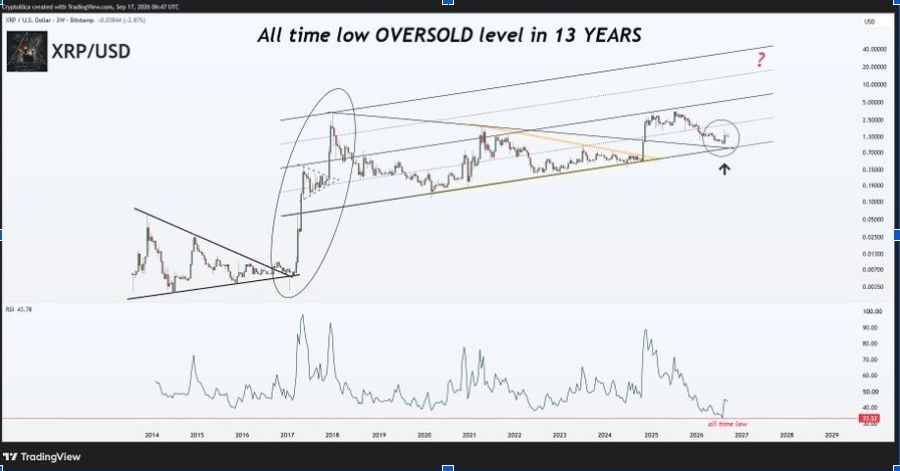
XRP is testing a long-term rising support structure after a sharp September pullback pushed the token's momentum to a historical extreme. A two-week XRP/USD chart shared by analyst Cryptollica placed the Relative Strength Index (RSI) near 33.5 — the lowest reading shown across roughly 13 years of XRP trading history. The RSI, a momentum oscillator introduced by J. Welles Wilder in 1978, measures the pace of price changes, and the two-week timeframe gives each chart point a 14-day window, so readings at this scale reflect extended stretches of trading rather than day-to-day swings.
The token last traded near $1.29–$1.30 after falling sharply from its September 14 level. The technical question now centers on whether the long-term support structure, which has held across several market cycles, can continue to hold. Separate analysts are tracking Elliott Wave counts and bull-flag formations, but their higher XRP targets remain conditional.
Two-Week RSI Hits a 13-Year Low Against a Long-Term Trendline
The first analysis tracks XRP's two-week RSI against a long-term trendline. The indicator sits in oversold territory and below the levels recorded during earlier sell-offs, including the lows of 2018, the 2020 COVID crash and the 2022 bear market. On this dataset, in other words, the current momentum reading is more stretched than at any of those prior episodes of heavy selling.
Price action has also returned close to the rising support line. XRP fell from $1.49 on September 14 to about $1.27 on September 15 before recovering toward $1.30. The token gained 6.09% on September 14, lost 9.80% the following day and added 1.22% on September 16 — a sequence that underlines the volatility surrounding the current support test.
The trendline connects a series of higher lows across several years, and XRP has not broken that lower boundary on the chart. Lines of this kind draw attention because they mark where prior declines stopped on a multi-year view. A move below it would break the structure highlighted in the analysis, while holding above it would keep the multi-cycle support line intact.
Elliott Wave Map Outlines Long-Duration Targets
A separate three-month XRP/USD chart from analyst Dark Defender tracks price inside a broad rising channel. The analysis applies an Elliott Wave structure — a framework that breaks trends into numbered swings — and labels the current phase as part of a larger five-wave sequence. The analyst places wave two near the lower channel boundary before projecting wave three toward the upper half of the channel.
The same chart marks several Fibonacci levels, including $1.8815 and $2.9032 near the lower part of the projected path. Higher extensions sit at $18.2275, $36.7676 and $74.3956, while the 161.8% long-range extension is placed at $333.1167. Fibonacci extensions are ratio-based projections used to map reference points ahead of price, and Dark Defender describes that final level as the Grand Wave 3 target, not a confirmed price outcome.
The projection also allows for a pullback between waves three and five. On that basis, the analysis places wave four near the $18.23 extension before another projected advance. The chart presents these levels as a long-duration scenario inside the rising channel, with each target dependent on the wave sequence unfolding as mapped.
Analyst Compares Current Setup to the 2024 Bull Flag
A third chart, published by analyst JackTheRippler, compares the current setup with XRP's price action during the 2024 rally. The analyst identifies a downward-slo consolidation following a sharp upward move in both periods and labels each formation a bull flag, presenting the 2026 pattern alongside the earlier one.
On the 2026 side, XRP is shown consolidating roughly between $1.35 and $1.50 after a rapid rise from near $1.05. The illustration then maps a move above the descending pattern toward the $1.70–$1.80 region. That path represents the analyst's scenario rather than an established target, and the comparison depends on XRP breaking out of its current consolidation. Until that happens, the 2024 pattern serves only as a historical reference.
A continued move inside the descending channel would keep the flag structure intact. The near-term setup now centers on the rising support structure and the current RSI reading: XRP still trades above the long-term line on the two-week chart, while momentum sits at a historical extreme within the dataset shown. Because the two-week timeframe only updates every 14 days, both the indicator reading and the candle's position relative to the line will remain in flux until the current period closes. As long as XRP holds above the rising line, the multi-cycle support structure remains in place, keeping support and momentum at the center of the token's next technical test.
This article is for informational purposes only and does not constitute financial or investment advice. Technical indicators, chart patterns and analyst price targets do not guarantee future price performance.
This article first appeared on The Market Periodical.

